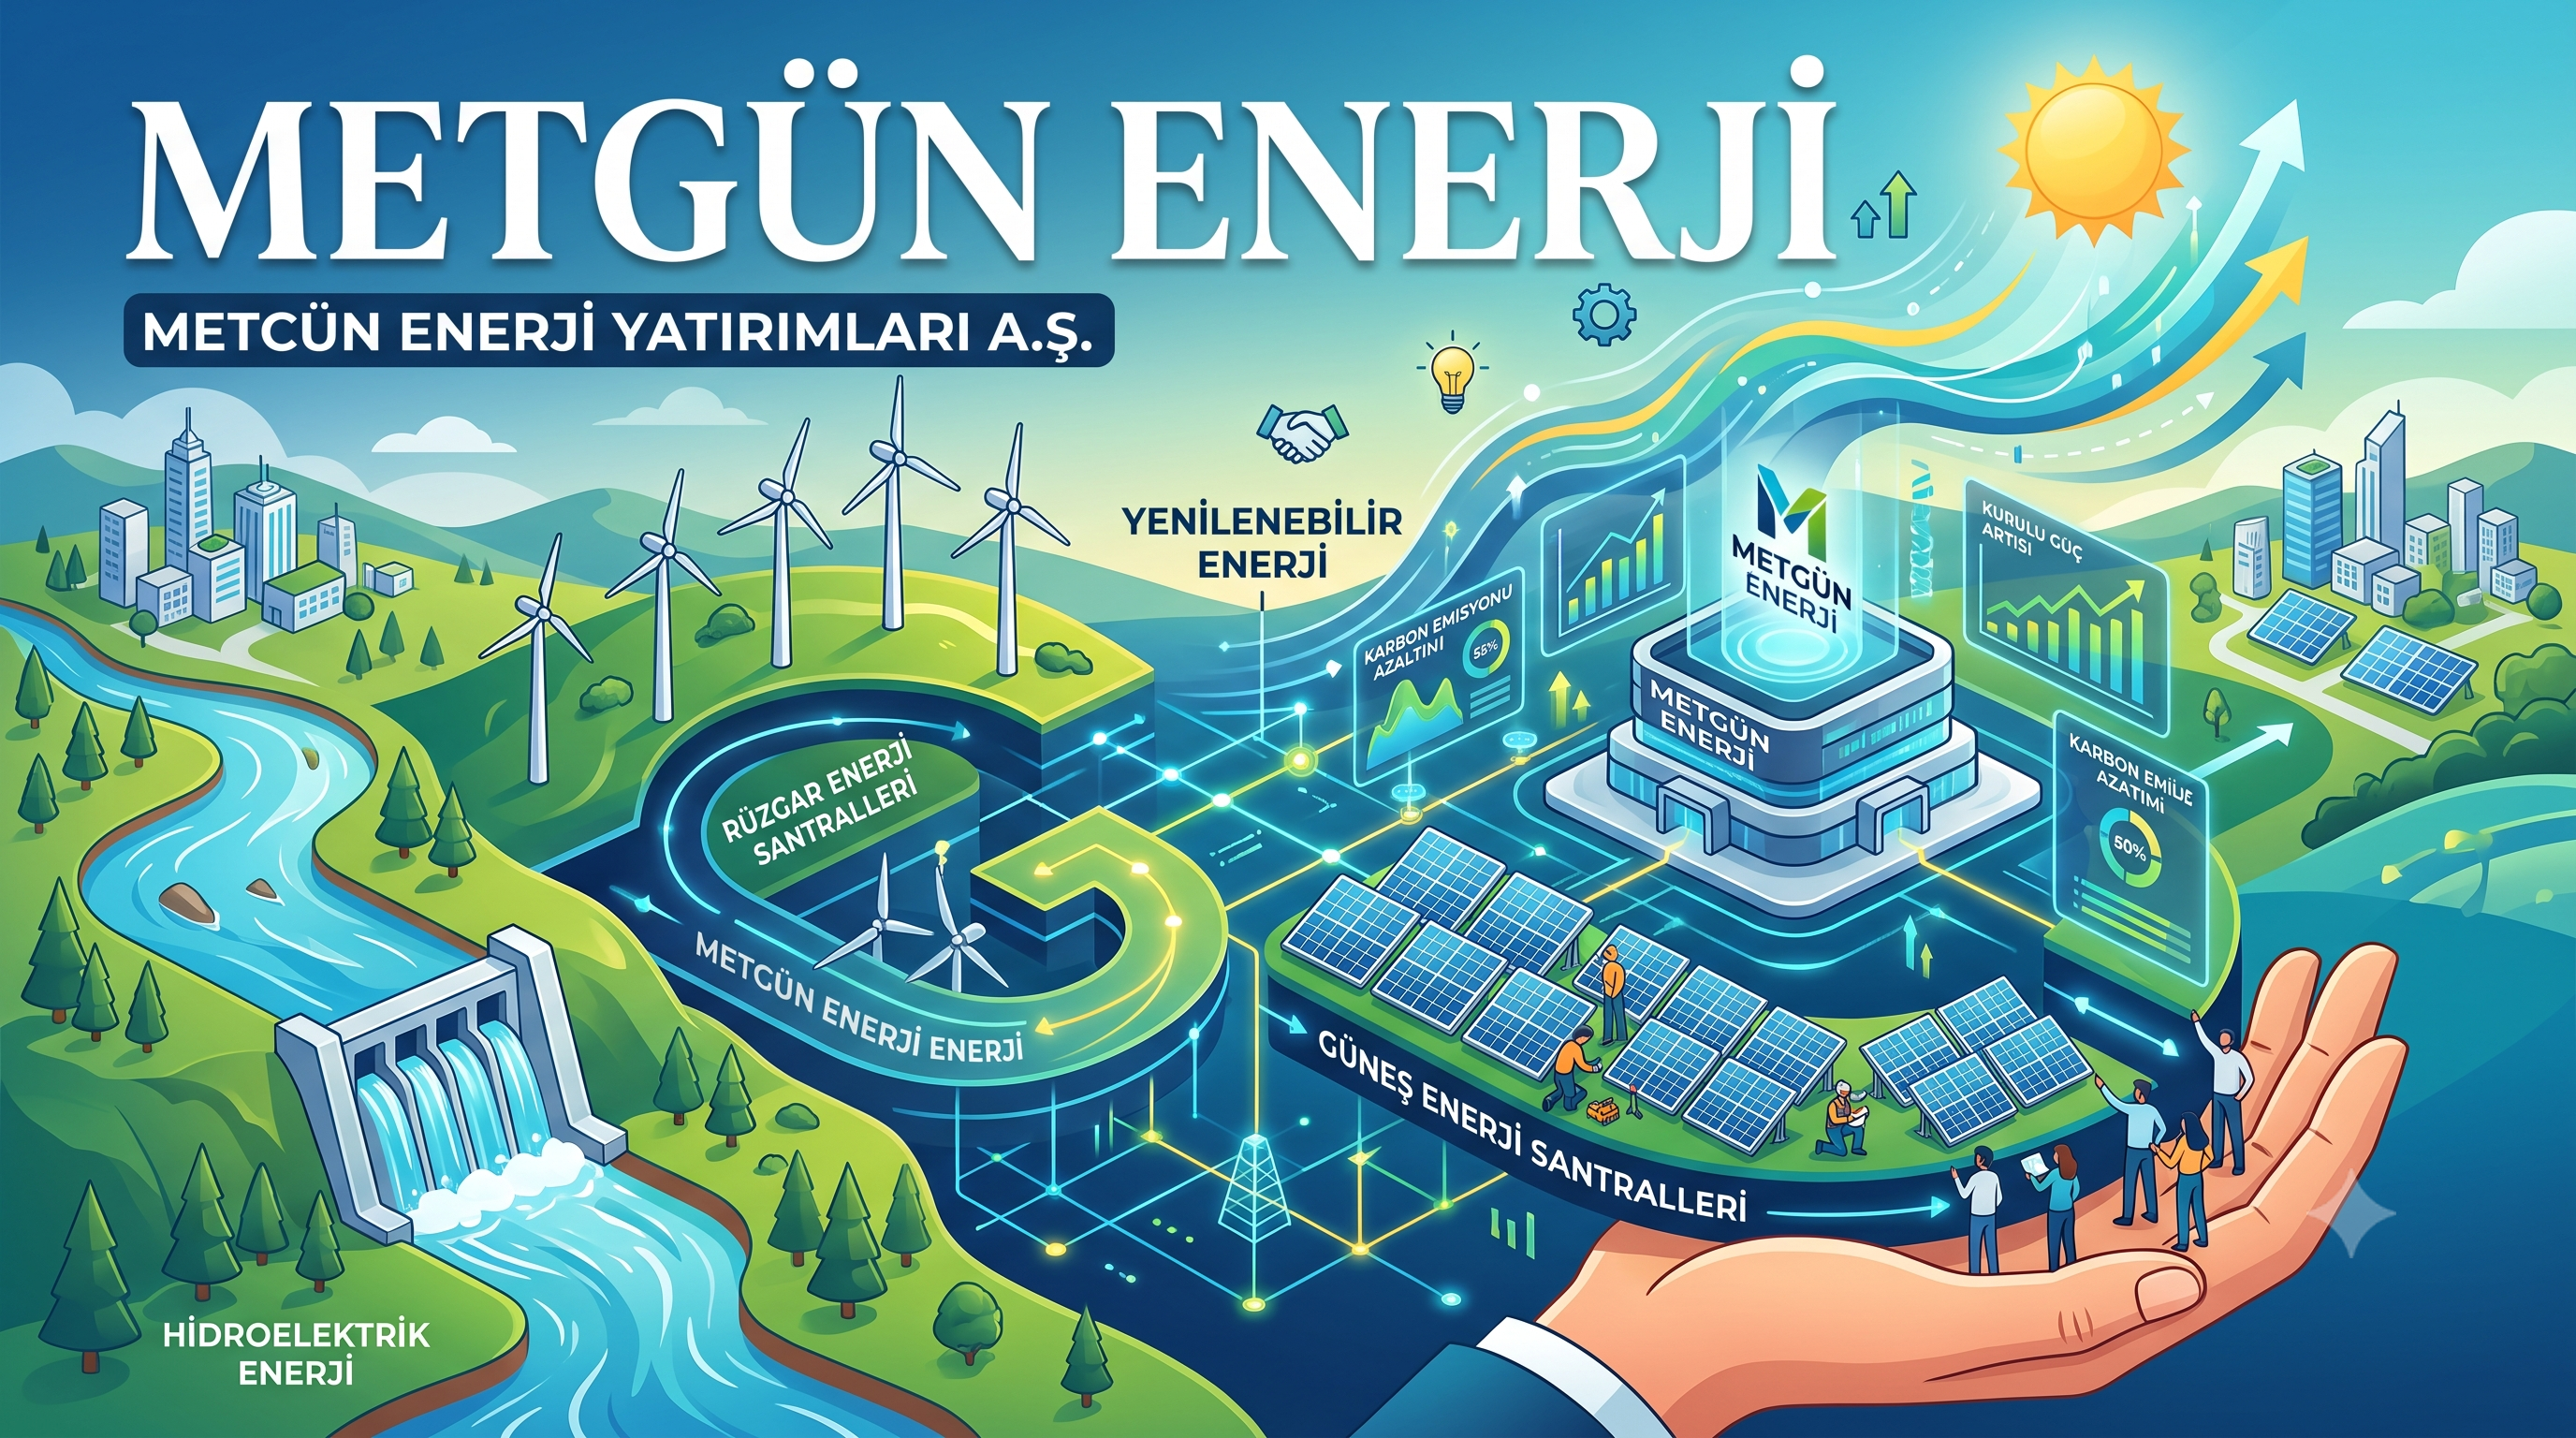
We’ve seen a non-stop wave of energy company IPOs lately. To be frank, I often vent my frustration about how many of these businesses aren’t really investable, though I always welcome high-quality companies joining the exchange. Rather than rehash basic details like the IPO date or allotment figures that anyone can look up, this post takes an **investor’s perspective** on Metgün Enerji’s IPO structure, shareholder sale details, planned use of proceeds, debt load, and operational growth potential.
IPO Structure and Shareholder Sale
On paper, about one-third of the IPO appears to be a shareholder sale, but digging into the details tells a different story. The proceeds from this sale will be used by the selling shareholder to pay down debt owed back to the company. So while it looks like a secondary sale on the surface, all of the funds will indirectly end up in the company’s treasury. At first glance, that’s a positive setup.
However, there’s a key question mark we shouldn’t overlook: **Why did the controlling shareholder need to borrow this much from the company in the first place, and could a similar situation happen down the road?** Based on my review, there is no explicit commitment guaranteeing this won’t happen again. As a result, I believe this area requires cautious monitoring.
Use of Proceeds and Cash Needs
Looking at the planned allocation of IPO proceeds, the breakdown appears quite balanced based on my evaluation criteria:
- 80% to 90% allocated to new renewable energy plants (wind and solar projects with storage),
- 10% to 20% reserved for working capital.
Earmarking such a heavy share for capital investment with clear targets is encouraging. The roadmap includes storage-backed wind and solar projects, inorganic acquisitions, participation in capacity allocation tenders, hybrid plant installations, and capacity expansions. I view these steps as very positive, as they directly focus on scaling core operations.
Operational Structure and Growth Potential
Metgün Enerji primarily generates electricity through wind, solar, and hydroelectric power plants, alongside a minor fertilizer sales arm that has a minimal impact on revenue. The company’s current installed capacity stands at **186 MW**. With ongoing investments scheduled for completion by year-end, target capacity is set to reach **257 MW**.
That represents a **capacity increase of nearly 40%**, which should be factored into any forward-looking discounted cash flow (DCF) valuation models. On the flip side, given recent Market Clearing Price (PTF) trends, power generation isn’t an industry I find particularly attractive right now—though I can still appreciate the positive growth steps the company is taking.
Debt, Receivables, and Cash Cycle
Examining the company’s financial structure, the cash balance and debt maturity profile immediately stand out. The company holds **TRY 257 million** in cash. Given the operational profile, this cash level looks sustainable provided there are no extraordinary borrowings or unexpected capital expenditure.
Regarding trade accounts, there is a **net negative position of TRY 440 million** (TRY 136 million in receivables against TRY 576 million in payables). Days sales outstanding / receivables turnover tell an interesting story: after sitting at 49 days in 2023, 24 days in 2024, and 66 days in 2025, it spiked to 170 days in the Q1 2026 balance sheet. This significant increase in payable settlement times is attributed to equipment and construction expenses for the Elmacık Wind Power Plant expansion.
The **TRY 717 million** in other receivables listed under current assets represents the shareholder debt that will be settled using the IPO proceeds, as noted earlier. Similarly, the **TRY 684 million** in prepaid expenses under current assets is tied to the Elmacık project, meaning it doesn’t pose an immediate cash drain. However, when you combine the company’s ~TRY 400 million in cash reserves with the 10% to 20% working capital allocation from the IPO, the combined funds barely cover existing trade payables.
On the short-term debt side, upcoming maturities are creating a noticeable bottleneck. Breaking down the **TRY 1 billion** in short-term liabilities:
- Due within 4 to 12 months: TRY 940 million
- Due within 0 to 3 months: TRY 449 million (which should have been settled as of the Q1 2026 balance sheet)
These metrics indicate that the company heavily depends on the cash inflow from the IPO to navigate the current year comfortably. Meanwhile, long-term debt stands at a substantial **TRY 4.26 billion**. The long-term debt maturity schedule breaks down as follows:
- Due in 1 to 2 years: TRY 371,000,072
- Due in 2 to 3 years: TRY 378,017,139
- Due in 3 to 4 years: TRY 366,572,100
- Due in 4 to 5 years: TRY 362,481,105
- 5 years and beyond: TRY 2,082,922,783 (more than half carries a maturity over 5 years)
Capacity, Investments, and Income Statement
A debt load of this magnitude naturally exerts heavy pressure on financing costs. Looking at the income statement, revenue has grown around 30% since 2023 but has remained flat over the past two years. This flatlining raises questions, especially given the company’s long-term Renewable Energy Support Mechanism (YEKDEM) agreement. In Q1 2026, revenue weakness persisted, falling back to levels last seen 3 to 4 years ago.
Here is how profitability margins have evolved over time:
| Period / Margin Type | Gross Margin | EBITDA Margin | Operating Margin | Net Profit Margin |
| 31.03.2026 (Annualized) | 21.3% | 46.5% | 6.8% | 17.3% |
| 2025 | 21.3% | 48.2% | 6.8% | 17.3% |
| 2024 | 48.8% | 60.0% | 36.3% | 39.2% |
| 2023 | 55.7% | 51.4% | 38.4% | 249.3% |
While net profit margin appears reasonable at first glance, it is heavily distorted by net monetary position gains. From a conservative analytical perspective, I believe it is crucial to strip out these non-cash, inflation-adjustment line items.
For example, in 2025, the company generated TRY 2.07 billion in revenue against TRY 1.629 billion in cost of goods sold, yielding TRY 440 million in gross profit. Factoring in operating income and expenses brings operating profit to +TRY 140 million, and investment activities bump that to +TRY 322 million. However, once you deduct -TRY 531 million in net finance costs and -TRY 113 million in tax expenses, the underlying operational and financial reality is a **loss of TRY 322 million**.
The primary line item keeping the company in positive territory on paper is a **TRY 681,544,775** net monetary position gain. The key drivers behind the 2025 net monetary gain include:
| Items Generating Gain / Loss | Impact as of December 31, 2025 (TRY) |
| Property, Plant, and Equipment | 2,971,687,326 |
| Intangible Assets | 206,273,919 |
| Investments Accounted for Using the Equity Method | 60,343,177 |
| Deferred Income | 6,520,601 |
| Right-of-Use Assets | 5,986,168 |
| Prepaid Expenses | 747,464 |
| Paid-in Capital (Negative Impact) | (263,072,843) |
| Accumulated Other Comprehensive Income/Expenses (Negative Impact) | (1,693,788,378) |
| **Net Monetary Position Gain** | **681,544,775** |
As the table shows, the ~TRY 3 billion accounting benefit from fixed asset revaluations creates paper profit but generates no cash flow to service debt. This highlights the need for careful scrutiny regarding cash flow and debt sustainability. Diverting a larger portion of IPO proceeds to debt reduction or delaying certain capital expenditures to reinforce working capital might have provided a healthier balance sheet buffer.
Overall Assessment
Taking a holistic view, the company’s capacity expansion plans, renewable-focused strategy, and efforts to clean up insider debt via IPO proceeds stand out as positive factors.
On the flip side, the history of shareholder loans, stagnant (and recently declining) revenue despite fixed-rate tariff advantages, capacity utilization rates sitting below industry averages, and underlying operational losses once inflation accounting is stripped away all represent clear risk factors. From a valuation standpoint, a **TRY 12.7 billion** market capitalization feels quite optimistic given current financial metrics.
Additional Points to Check
- Individual financial statements and cash flow positions of subsidiaries.
LEGAL DISCLAIMER: This content does not constitute investment advisory services. Investment advisory is a personalized service provided based on an individual’s risk-return profile, financial standing, and investment objectives. The information, commentary, and assessments provided herein are prepared solely for general informational purposes and should not be construed as investment recommendations or guidance. This content may not align with the reader’s financial position or risk-return preferences; therefore, investing based solely on this information may not yield the expected outcomes.