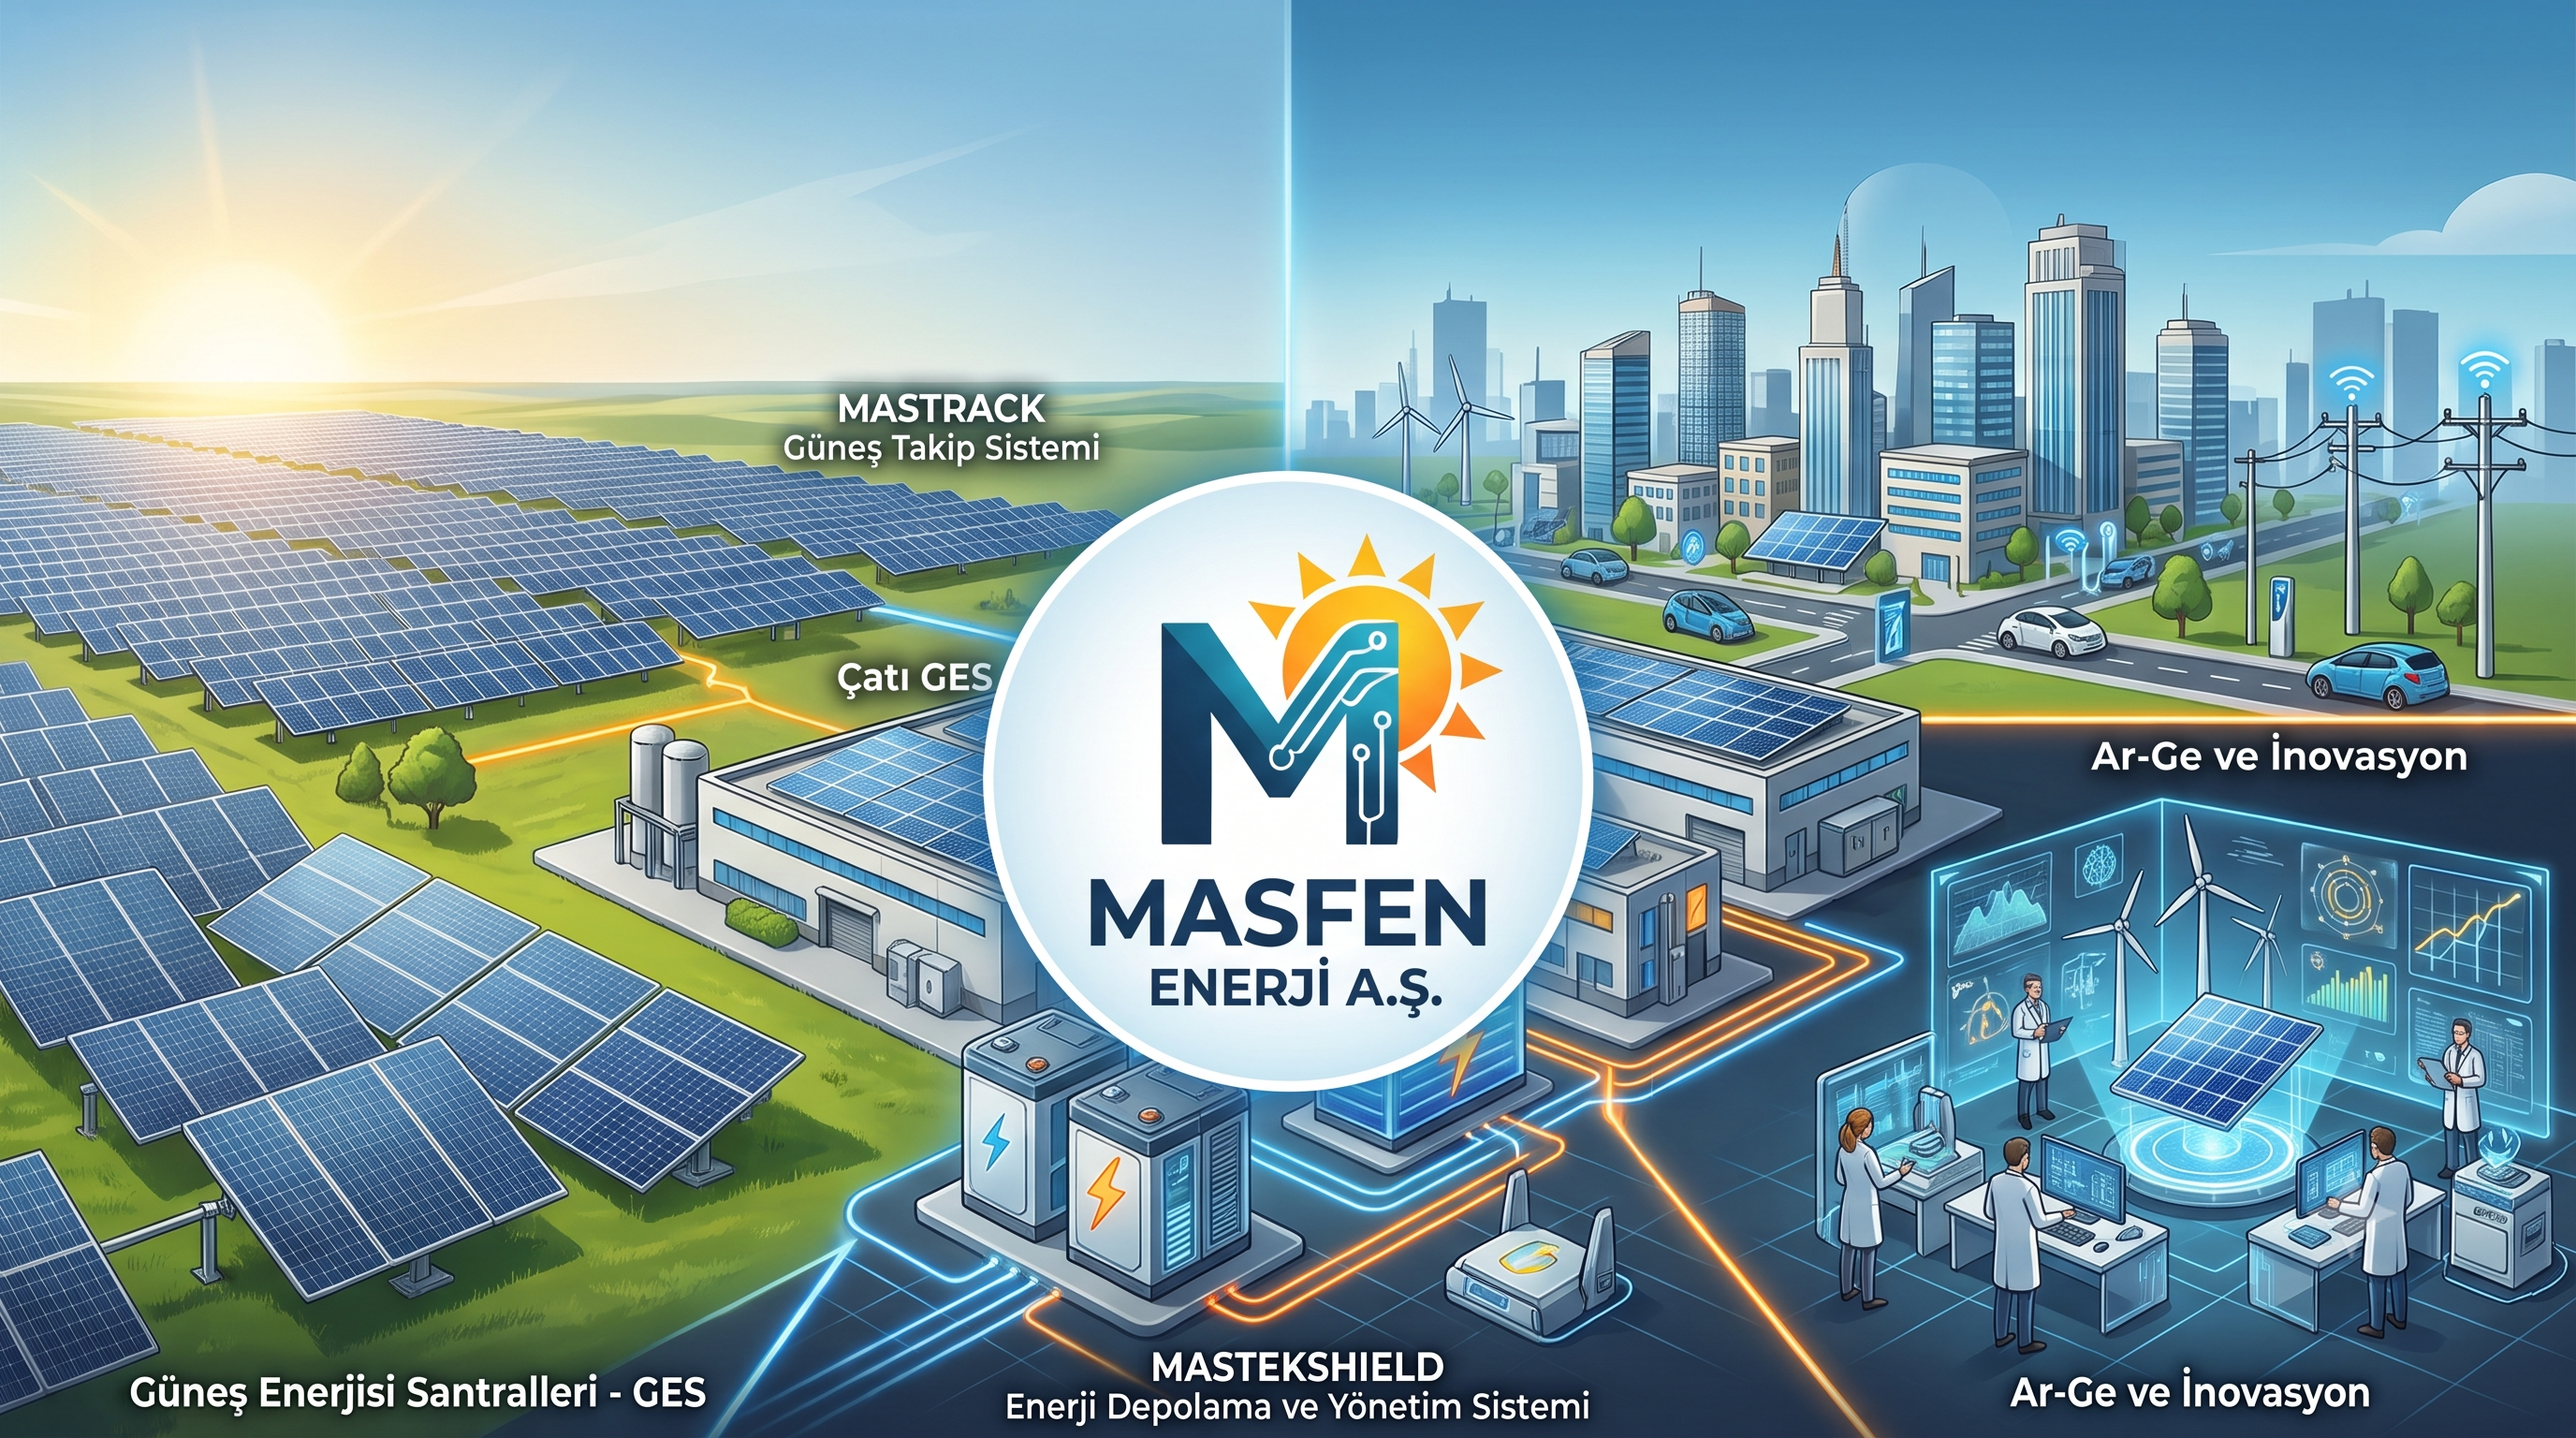
Increased rainfall in recent months has boosted hydroelectric power generation, driving Market Clearing Price (PTF) levels lower. This environment, combined with high capital expenditure requirements, previously made me somewhat cautious toward energy companies solely focused on power generation. However, the company under review boasts a portfolio built entirely on renewable energy and operates not only in generation but also in engineering, procurement, and construction (EPC) for facility installations. This dual focus shifts my initially hesitant stance in a positive direction.
In this post, rather than focusing on participation details, I will examine the company’s financial structure, use of proceeds, cash cycle, operational strength, and valuation logic from an investor’s perspective.
IPO Structure and Share Sale by Existing Shareholders
Looking at the IPO structure, the capital increase accounts for roughly **65%**, while the share sale by existing shareholders makes up **35%**. A 35% existing shareholder sale ratio might initially seem relatively high. On the other hand, keeping the free float ratio at a reasonable **15.32%** and setting the IPO discount rate at **20%** help balance the picture.
Additionally, allocating **34%** of the gross IPO proceeds to support price stabilization for 15 days stands out as a positive indicator for the post-IPO period.
Use of Proceeds and Capital Requirements
The planned allocation of the IPO proceeds is as follows:
75% Renewable Energy Investments
25% Working Capital for Engineering and Project Development
Given that the company shows no troubling signs regarding current debt levels or cash flow, this capital allocation appears well-balanced. Directing the larger 75% share primarily toward international investments carries solid potential: it cushions the company against domestic Market Clearing Price (PTF) fluctuations while offering an added boost during periods when FX-denominated margins approach historical averages.
Operational Structure and Growth Profile
The company generates all of its revenue from renewable energy production and power plant installation services. Its current operational setup and growth plans can be summarized as follows:
Current Installed Capacity: Out of a total installed capacity of **117 MWe**, **105.84 MWe** is located domestically in Türkiye, and **10.94 MWe** is in Greece. The plant in Greece is backed by a 20-year fixed-income feed-in tariff agreement (similar to Türkiye’s YEKDEM framework), with 17 years remaining.
International Projects: In Romania, the company has an ongoing facility investment with a planned installed capacity of 65.1 MWp, scheduled for completion by the end of 2027. Selling the electricity generated here at a fixed price, coupled with Romania’s **16%** corporate tax rate, offers a clear operational edge.
Engineering and Construction Expertise: A track record of **611.1 MWp** in completed projects solidifies the company’s industry reputation while enabling it to build its own proprietary assets at lower costs.
Carbon Credits: While executives mentioned in interviews that the company holds carbon credits and plans to sell them when market prices are favorable, the prospectus contains no explicit details or confirmed figures. If verified, this could positively impact current assets.
Debt, Receivables, and Cash Cycle
One of the most compelling strengths on the company’s balance sheet is its strong cash position. Cash and cash equivalents stand at **TRY 4.575 billion**.
Receivables and Payables Balance: Against trade receivables of around TRY 200 million, the breakdown shows items of TRY 102 million and TRY 98 million. Days sales outstanding (DSO) sits at 13 days, while days payables outstanding (DPO) is 8 days. Considering the nature of the business, these numbers point to a remarkably efficient cash cycle.
Liability Structure: Short-term liabilities remain very low at **TRY 45 million**. Meanwhile, long-term liabilities of **TRY 430 million** and deferred tax liabilities of **TRY 872 million** can comfortably be covered by the **TRY 1.742 billion** in contract assets on the balance sheet.
Cash Management, Income Statement, and Margins
Looking at the financial statements, revenue surged significantly between 2023 and 2024, flattened in 2025, and regained momentum in the first quarter of 2026.
Margin trends across these periods are as follows:
| Period | Gross Margin | EBITDA Margin | Net Profit Margin |
| 2023 | 35.1% | 40.3% | 29.4% |
| 2024 | 50.7% | 53.9% | 51.5% |
| 2025 | 43.8% | 44.8% | 46.5% |
| 2026 (Q1) | 24.1% | 26.9% | 27.7% |
In the current high-interest environment, operating debt-free with robust cash reserves offers a major competitive edge. In 2025, while core operating profit stood at **TRY 1.554 billion**, income from investment activities reached **TRY 1.450 billion**. In the first quarter of 2026, investment income hit **TRY 409 million**, surpassing the core operating profit of **TRY 268 million**. In short, the return generated on idle cash exceeded income from core operations.
Under normal conditions, cash on this scale would ideally be deployed into CAPEX or paid out as dividends rather than sitting in interest-bearing accounts. However, in today’s environment of elevated real interest rates and challenging investment conditions, delaying CAPEX to optimize timing while capturing yield on cash is a sensible strategy. With renewable energy installation costs declining over time and held cash yielding **44%–50%** annually, this waiting period appears rationally managed. Although competitive pressure remains the primary risk in the sector, rising global energy demand driven by AI infrastructure helps mitigate that threat for now.
Capacity, CAPEX, and Valuation Notes
The company’s medium-to-long-term goals include expanding installed capacity to **500 MW** by 2028 and reaching **1,000 MW** by 2030.
In the Price Assessment Report, a market capitalization of **TRY 25.352 billion** was calculated by applying a **20%** discount. This valuation used Discounted Cash Flow (50%) and Peer Multiples Analysis (50%) with equal weightings.
While the technical methodologies appear standard, the IPO valuation strikes me as somewhat rich. Here is why:
- Transitory Nature of Investment Yields: Investment income—which effectively doubled recent net profit—does not reflect sustainable core operational earnings.
- CAPEX Expansion Pressure: Scaling installed capacity from 117 MWe to 1,000 MWe will demand massive capital expenditure. Growing from 117 MWe to 1,000 MWe is a major 4-to-5-year expansion, even for industry giants.
- Future Profit Margins: As cash is deployed into projects between 2027 and 2030, financial income will taper off. Concurrently, as interest rates and exchange rates normalize, net profit margins could pull back from current levels.
Optimistically assuming the company hits its 2030 targets, a rough back-of-the-envelope calculation based on peer multiples and a 20% long-term inflation expectation yields a projected 2031 market capitalization in the **TRY 50–55 billion** range. Offering roughly **100%** upside over a 5-year horizon suggests that the current IPO price has already baked in a substantial portion of future expectations. This estimate relies entirely on my personal assumptions and carries no certainty.
Overall Assessment
Overall, the company presents an appealing profile backed by near-zero debt, a formidable cash position, in-house EPC capabilities to build its own plants, and an internationally focused expansion strategy.
On the flip side, the 35% existing shareholder sale ratio, the massive CAPEX requirement needed to achieve the 1,000 MW goal, and the narrow margin of safety in the current valuation represent key risks to monitor. While the company demonstrates strong operational capabilities, the tight valuation suggests that financial results and project execution warrant close tracking in the period ahead.
LEGAL DISCLAIMER: This content does not constitute investment advisory services. Investment advisory is a personalized service provided based on an individual’s risk-return profile, financial standing, and investment objectives. The information, commentary, and assessments provided herein are prepared solely for general informational purposes and should not be construed as investment recommendations or guidance. This content may not align with the reader’s financial position or risk-return preferences; therefore, investing based solely on this information may not yield the expected outcomes.