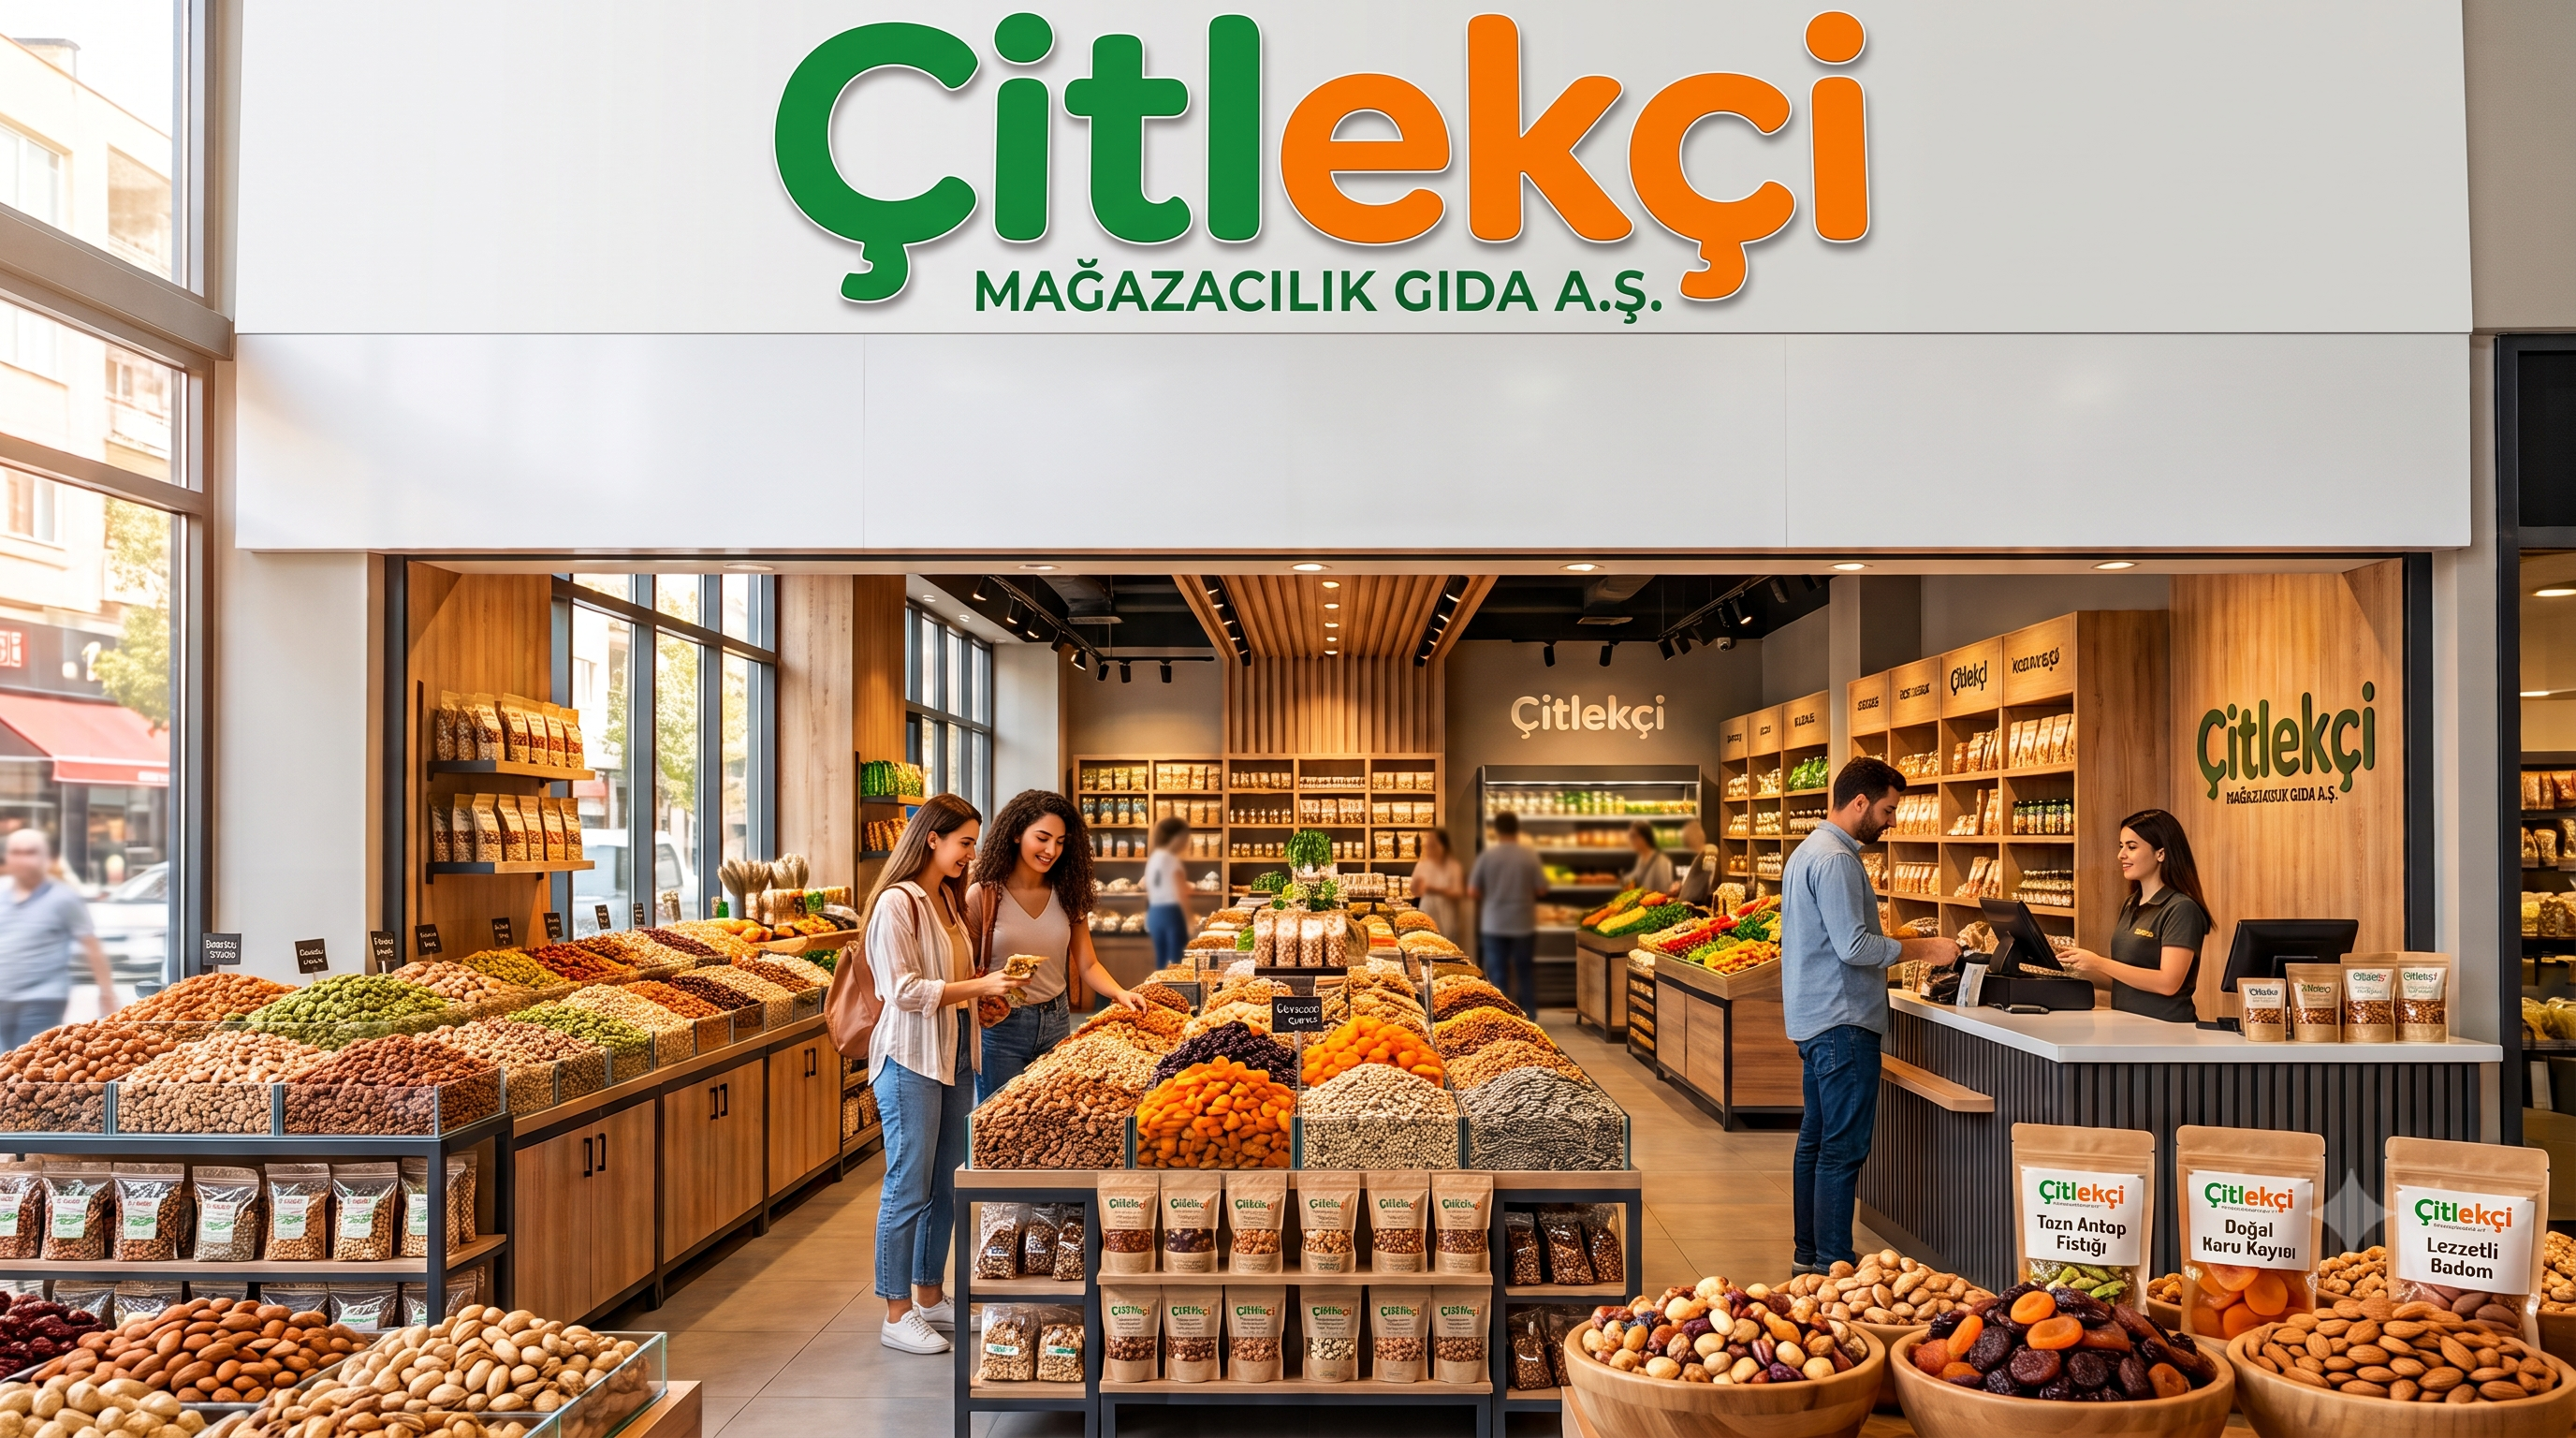
The company was founded in 2011, centered around Ankara and the surrounding region. In 2019, it began operating in the e-commerce channel. In fact, I even bought products from them online a few times around 2020. It offers a product portfolio featuring more than 1,000 items. Its core business can be defined as food retailing—more specifically, dried nuts and snacks retailing.
In the past, they had ventures in the construction sector as well, but in 2024 they decided to pull out of that industry completely. Having stepped away from construction, they have now transformed into a business focused entirely on the dried nuts and snacks sector.
Since I reside in Ankara, I get to observe their stores firsthand. Their store concept isn’t styled like discount chains such as A101 or BİM; rather, it’s set up more like large Migros stores. They open spacious outlets at strategic locations. While they generate most of their sales through these physical stores, they’ve also been actively operating in e-commerce for the past seven years. Looking at the store interiors—which I’ve experienced myself over the years—they used to project a distinctly premium feel. Over time, as other retailers introduced similar innovations, today it’s fair to say they offer a pleasant, niche atmosphere.
Retail Sector Valuation and Multiple Analysis
When analyzing retail companies, we run into a wide array of metrics and ratio calculation methods. Because retail businesses generally operate by purchasing and reselling goods, they don’t directly add value to the products themselves. Of course, as long as the business generates profit, the product’s own inherent added value doesn’t strictly matter; however, the value created by the company itself is essential to me. In the nuts and dried fruit sector, there aren’t many companies operating on this scale—with a thousand-product portfolio—either on the stock exchange or across Turkey as a whole. For that reason, I want to state upfront that the peer multiple analysis in the valuation report doesn’t quite hold up for me.
The valuation based on the Discounted Cash Flow (DCF) method holds much greater weight for me. Since we know DCF valuations in valuation reports can sometimes feature inflated numbers, I prefer to run my own evaluation even though I read institutional reports. When examining a company’s overall profile, I dive into these detailed assessments if the business leaves a solid impression. Although data is still somewhat limited since the company is currently in the IPO phase, we can still perform certain calculations.
IPO Structure, Ownership, and Use of Proceeds
Looking at the structure of the IPO, capital expansion accounts for 82.5%, with the remainder offered via shareholder secondary sales. The sole institutional shareholder appears to be Tunçlar Yatırım Holding. The holding itself is divided equally among three siblings with 33% shares each, meaning we’re dealing with a family business.
The remainder of the IPO proceeds goes to the selling shareholders through secondary share sales. However, a key detail for me is that the capital generated from these shareholder sales can be used for price stabilization in the event of potential price drops. This policy indicates that management doesn’t view the IPO merely as a cash-out opportunity for existing owners; rather, they care about ensuring a healthy market debut and supporting the stock’s market performance. Thus, I get the impression that these secondary sales were designed as an integral part of the IPO structure rather than simple insider cashing out.
The decision to list roughly 20% of the company—a very reasonable float in my view—is another positive point. Keeping the free float moderate allows the existing partners to retain significant sway and control, while still enabling the firm to raise the capital it needs from capital markets. In growing companies in particular, I don’t care much for excessively high free floats. Diluting current shareholders’ stakes too much before the business fully realizes its growth potential rarely makes sense to me.
A 20% float opens enough room for public investors to gain exposure while ensuring the primary partners maintain a substantial stake. Therefore, I find the float size well-balanced in light of the company’s current scale and future expansion goals.
The valuation report sets the total market cap at 13.266 billion TRY. However, determining whether this valuation is truly reasonable requires more than just looking at the float ratio or the growth story. Only after examining the financial statements, asset structure, leverage, profitability, and future cash generation potential can we make a sounder judgment on whether this market cap is cheap, expensive, or fair.
Operational Infrastructure: Facilities, Warehouses, and Store Network
Looking at the company’s facilities, it owns a processing plant in Kırıkkale alongside a plot of land with a silo area in the same location. As a retail business, storage capacity is critical. On the warehousing side, it owns a 7,500 m² facility and leases two additional warehouses measuring 8,500 m² and 6,000 m² under 10-year lease agreements.
In the retail sector, warehouse rent and POS commission fees are among the major cost drivers that directly impact operational profitability. That is why, rather than looking solely at the raw figures for these expenses, I believe it’s essential to track their trajectory as a percentage of revenue over time. As the business expands, economies of scale, more favorable lease renewals, or lower POS commission rates can drive these expenses down as a portion of revenue. If the company can grow sales while keeping these costs in check without letting them expand at the same rate, it will create a distinct tailwind for margin expansion down the line. Potential efficiency gains here could thus serve as a strong argument in the company’s favor as we dive deeper into our financial analysis.
On the retail store front, the company has 43 locations. Two of these are non-retail operational centers. Of the remaining 41 branches, 40 are actively generating sales, while 1 is registered but not yet operational—most likely currently under fit-out. Among the sales locations, 3 are company-owned under joint/shared ownership structures. The remaining 38 stores operate under lease agreements.
Growth Dynamics and Sectoral Potential
When we look at headcounts and past store numbers, we see accelerating growth. From what I observe in my own surroundings, there is growing demand in Turkey both for nuts and dried fruits generally and for this specific company as its brand-building efforts take hold.
While headcounts stood at 792 in 2023, the latest Q1 2026 financial statements show staff numbers reaching 1,219. Similarly, the store count rose from 23 in 2023 to 41 in 2026. Roughly speaking, over this three-year stretch, both headcount and store footprint grew by 1.5x to 2x.
Considering the ongoing tight monetary policy and high interest rate environment in Turkey, the fact that the company achieved such expansion during this period is very telling. I lean toward the view that a business capable of nearly doubling over three years during high interest rates and tight monetary policy can comfortably scale 2.5x to 3x over a similar horizon ahead, maintaining rapid growth until the market reaches saturation.
Operational Metrics Per Store
Without getting bogged down in details, a few metrics are worth highlighting. Looking at the current 41 stores and total headcount—even accounting for corporate headquarters staff—the average works out to roughly 30 employees per store. As scale increases, the average headcount per store should decrease. By utilizing wage levels and store-level headcount averages, we can estimate potential costs and revenues for every new store opening down the road. That’s the beauty of retail financial modeling: if we project that the company will open 10–12 stores a year, we can estimate revenue, expenses, and profit margins using this exact approach.
Another key metric worth examining is revenue per visitor. Looking at 2025 sales transactions, the company recorded just over 8.5 million total transactions. If we assume each transaction represents an average family of three, we arrive at roughly 25 to 28 million visitors. Company filings, however, report this figure closer to 32 million. They may be applying a different methodology here, so it makes sense to rely on company guidance for our analysis. Working off their disclosed figure yields revenue per visitor of roughly 300 TRY.
Another critical metric in retail is the average basket size. Based on 2025 data, the company’s average basket size came out to roughly 915 TRY. Additionally, annual foot traffic averages about 2.6 million visitors per store.
Of course, diving deeper into the prospectus or valuation report provides store-by-store breakdowns. Given variations in location, store footprint, and customer traffic, it’s completely natural that certain stores outperform the average while others lag. However, given the company’s continuous store rollouts, overall averages provide far more actionable signals for my analysis than individual store data.
I find these metrics particularly valuable for forecasting. When management discloses future store expansion plans, we can leverage per-store foot traffic, basket size, and revenue per visitor to project expected top- and bottom-line contributions from new locations. Consequently, these operational metrics will serve as crucial building blocks for calculating growth targets and long-term earnings capacity in subsequent sections.
At this stage, there’s no need to dwell excessively on these figures. Far more granular breakdowns are readily available in the valuation report. I simply wanted to map out these metrics here to illustrate the operational model and establish baseline inputs for our future projections.
Use of Proceeds and Investment Strategy
The company’s planned allocation of IPO proceeds is structured as follows:
- Working Capital: 30%–40%
- New Branch & Alternative Investments: 30%–40%
- Warehouse Investments: 10%–20%
- Solar Power Plant (SPP) Investments: 10%–20%
I expect the Solar Power Plant (SPP) investment to drive down electricity expenses meaningfully while creating a positive brand ESG halo around green energy transition.
Evaluating warehouse capacity alongside store growth—given the three existing fulfillment centers—suggests the company requires roughly 6,000 to 9,000 m² of new warehouse footprint for every 12 to 14 new stores. From this perspective, assigning 30%–40% to new stores and alternative investments aligns seamlessly with allocating 10%–20% to warehouse infrastructure. As physical retail expands, logistics capacity must scale in tandem, demonstrating that capital deployment is tailored directly toward operational scaling.
Allocating a significant portion to working capital also makes absolute sense given the business model. Opening a new store involves more than just lease commitments and store fit-outs; it requires substantial inventory investments to fill shelves and maintain robust product breadth. As store count expands, working capital requirements scale predictably. Earmarking a major chunk of IPO proceeds for working capital is therefore a natural and necessary component of their growth plans.
Balance Sheet and Asset Structure Analysis
Examining the balance sheet, inventories stand out as one of the most prominent items within current assets, coming in at around 1 billion TRY after trending mostly flat over recent years.
Just as with headcounts, dividing inventory levels by store counts gives us average per-store inventory values that feed into forward projections. As store footprints expand, baseline inventory requirements naturally rise. Additionally, management may periodically boost inventory levels to capitalize on opportunistic bulk procurement. Therefore, inventory volumes and warehouse requirements must both be analyzed through the lens of store footprint expansion.
Out of approximately 1.8 billion TRY in current assets, inventory accounts for 1 billion TRY, cash and cash equivalents comprise 457 million TRY, and trade receivables total roughly 43 million TRY. The modest trade receivables figure is particularly noteworthy. This reflects the retail business model: because sales are conducted via cash or debit/credit cards, receivables convert to cash almost instantly. Consequently, revenue turns into cash rapidly without building up large trade receivables on the balance sheet—a pattern that has remained consistent historically.
Another notable item among current assets is deductible VAT (VAT carried forward), which stands at roughly 267 million TRY and has steadily increased over the years. Even before analyzing the income statement in detail, rising deductible VAT offers subtle hints regarding expanding operational volumes. While deductible VAT doesn’t flow directly into P&L profits, it plays a key role in working capital cash conversion cycles. In retail, buying inputs at a higher VAT rate (e.g., 20%) while selling finished goods at a reduced VAT rate (e.g., 1%) creates cumulative deductible VAT balances on the balance sheet. This easily overlooked nuance warrants close attention when assessing working capital efficiency.
Moving from current to non-current assets, total non-current assets stand at approximately 3.58 billion TRY. Aside from property, plant, and equipment totaling roughly 2.3 billion TRY, two specific line items stand out: investment properties and right-of-use assets arising from operating leases.
Investment properties include land and buildings held by the company. Notably, despite no real estate acquisitions being added to the portfolio, the carrying value of these assets increased over time due to inflation accounting adjustments and revaluations. The second major line item is right-of-use assets. Under IFRS 16 (TFRS 16), long-term leases are recognized on the balance sheet as right-of-use assets alongside corresponding lease liabilities. Because the company enters into 10-year lease agreements, this item inflates non-current assets significantly.
When assessing company valuation, I make a clear distinction between right-of-use assets and directly owned land, buildings, or facilities. While right-of-use assets convey operational usage rights, they are not equity-owned property. Therefore, isolating them provides a truer picture of net tangible asset values. This right-of-use asset line item—standing at roughly 1.65 billion TRY—stems primarily from leased retail outlets and warehouses. I should clarify that when referencing the 3.5 billion TRY in non-current assets, I mentally adjust for this lease-accounting figure.
Revisiting investment properties, the company earns modest rental income from these assets. Filings indicate that certain properties are leased to major chains like A101 and Köfteci Yusuf. However, annual rental income comes out to just around 46 million TRY. Comparing this rental stream against property carrying values yields an unusually long payback period of roughly 50 to 60 years. It’s hard to see why management chooses to hold certain real estate assets at such low rental yields.
It will be worth watching whether future lease renewals, rent adjustments, or potential asset realignments improve cash yields on these properties over time.
Debt Position and Liabilities
Turning to the liability side, short-term financial debt stands at roughly 66 million TRY. Given current cash holdings, this amount is comfortable and easily manageable. Short-term debt fluctuated between 25 and 43 million TRY in prior years, demonstrating historically conservative financial leverage.
The main item within short-term liabilities is trade payables, totaling roughly 400 million TRY. Most of this balance represents obligations to third-party suppliers. Days payable outstanding (DPO) currently sits at around 27–28 days. It is interesting to see this payback period contract from 67 days in prior periods down to 27 days amid the high interest rate environment. Shorter payment windows for suppliers reflect changing macroeconomic credit conditions impacting working capital management.
The retail model offers a clear liquidity advantage here. Because revenues are collected upfront via cash or card payments, receivables convert into cash instantly. With rapid cash conversion offsetting 30-day supplier payment terms, working capital liquidity remains solid. Short-term obligations are easily covered by existing cash balances and strong daily collection cycles.
On the long-term liability front, figures show approximately 575 million TRY. Crucially, however, the company carries no bank debt, leaving its balance sheet compliant with Islamic finance Participation Index criteria. Most long-term liabilities represent IFRS 16 lease liabilities tied to multi-year rental agreements. Consequently, these accounting liabilities should not be conflated with interest-bearing debt or bank loans; they simply represent capitalized future lease commitments for stores and warehouses.
Additionally, liabilities include deferred tax provisions arising from temporary timing differences between accounting standards and tax reporting, which reverse naturally over time without impairing immediate cash flows.
Overall, the company operates with virtually no financial debt. Liabilities stem almost entirely from trade operations and lease accounting. The ability to meet short-term obligations comfortably through cash reserves and strong daily collection cycles is a clear balance sheet positive.
Income Statement and Profitability Analysis
Turning to the income statement, revenue has expanded above inflation annually, with cost of goods sold rising at a comparable pace.
Analyzing profitability margins, the upward trend in gross profit margin stands out immediately. While EBITDA margins fluctuated generally between 15% and 20% across periods, net profit margins exhibited sharper volatility. Nevertheless, operational profitability remained largely resilient.
- Gross Profit Margin: 2023: 26% | 2024: 25% | 2025 / Q1 (3-Month): 36% | 2025 (12-Month): 33% | 2026 / Q1 (3-Month): 32%
- EBITDA Margin: 2023: 20% | 2024: 14% | 2025 / Q1 (3-Month): 20% | 2025 (12-Month): 19% | 2026 / Q1 (3-Month): 17%
- Net Profit Margin: 2023: 7% | 2024: 4% | 2025 / Q1 (3-Month): 41% | 2025 (12-Month): 11% | 2026 / Q1 (3-Month): 21%
With revenue and cost of sales growing together, the upward trajectory in gross margin is encouraging. As the business gains scale, stronger purchasing power and bulk procurement leverage should provide further structural support for gross margins going forward.
On the operating expense front, general administrative expenses grew slightly as a percentage of sales, while marketing expenses were the most prominent line item. However, marketing expenses require context: accounting conventions classify store sales floor personnel wages under marketing expenses. Therefore, elevated marketing expenses primarily reflect operational store labor costs.
Because the company functions primarily as a reseller rather than a direct manufacturer, cost of goods sold consists mainly of merchandise inventory purchases. Additionally, legacy construction project costs appear in historical cost line items.
Operating profit expanded steadily alongside store rollouts. This is crucial: top-line expansion only matters if it converts efficiently into operating income, serving as a true indicator of scalable growth.
By year-end 2025, the company generated roughly 1.5 billion TRY in operating profit on 9 billion TRY in revenue. An operating margin near 20% is impressive for the retail sector. Maintaining these margins while adding store locations will translate store rollouts directly into robust earnings growth.
Another bright spot on the income statement is minimal financial expense. With no material interest-bearing debt, operating income flows to the bottom line without getting eroded by interest payments—a major competitive edge in Turkey’s high-interest environment.
In 2025, from a pre-tax income of roughly 1.5 billion TRY, corporate tax expense came in at 330 million TRY alongside 210 million TRY in deferred tax expenses. With total tax effects reaching ~540 million TRY, the company closed the year with approximately 1 billion TRY in net profit.
Overall, converting top-line growth into bottom-line profits matters far more than revenue volume alone. Low leverage, expanding gross margins, and sustained operational profitability despite rapid store rollouts will remain key metrics to watch when evaluating future earnings capacity.
General Assessment and Conclusion
Taking a step back, the key investment positives stand out clearly: expanding without debt reliance, tapping into rising sector demand, appealing across diverse income demographics, and channeling IPO proceeds directly back into growth.
The business model also appears resilient against external shocks. Leasing almost all store locations minimizes capital tied up in real estate. In the event of store closures or regional downturns, downside risks remain limited to inventory and operating expenses rather than illiquid real estate holdings. Furthermore, spreading inventory across 41 locations insulates the business from store-specific disruptions.
Achieving real growth during high inflation and tight monetary policy underscores operational strength. Expanding store counts and operating volumes without bank leverage in a high-cost environment highlights the durability of their economic moat.
On valuation, the 13.266 billion TRY IPO market cap isn’t dirt cheap. However, factoring in 3.5 billion TRY in non-current assets, debt-free net current assets, strong current profitability, and expected store rollouts, the valuation looks reasonable against future growth potential. For prospective investors, the core metric isn’t current earnings alone, but how effectively management reinvests IPO proceeds to scale profits in coming years.
Expecting significant dividend payouts from a high-growth retailer with substantial store expansion runway would be premature. Reinvesting cash flows into new store rollouts, logistics, and working capital creates far greater compounding value—provided return on invested capital remains strong. Until the market reaches saturation, growth should take priority over dividends. Once store rollouts mature, returning cash flows via dividends will make far more sense.
In conclusion, we see an easy-to-understand business model with a strong balance sheet, minimal leverage, and ample room for expansion. Scaling purchase volumes should bolster supplier bargaining power, yielding cost efficiencies over time while unlocking broader economies of scale across store and warehouse networks.
Naturally, monitoring long-term growth sustainability, unit economics of new store openings, and margin resilience at scale will be essential. Based on current fundamentals, however, both their growth strategy and capital allocation approach leave a favorable impression.
LEGAL DISCLAIMER: This content does not constitute investment advisory services. Investment advisory is a personalized service provided based on an individual’s risk-return profile, financial standing, and investment objectives. The information, commentary, and assessments provided herein are prepared solely for general informational purposes and should not be construed as investment recommendations or guidance. This content may not align with the reader’s financial position or risk-return preferences; therefore, investing based solely on this information may not yield the expected outcomes.