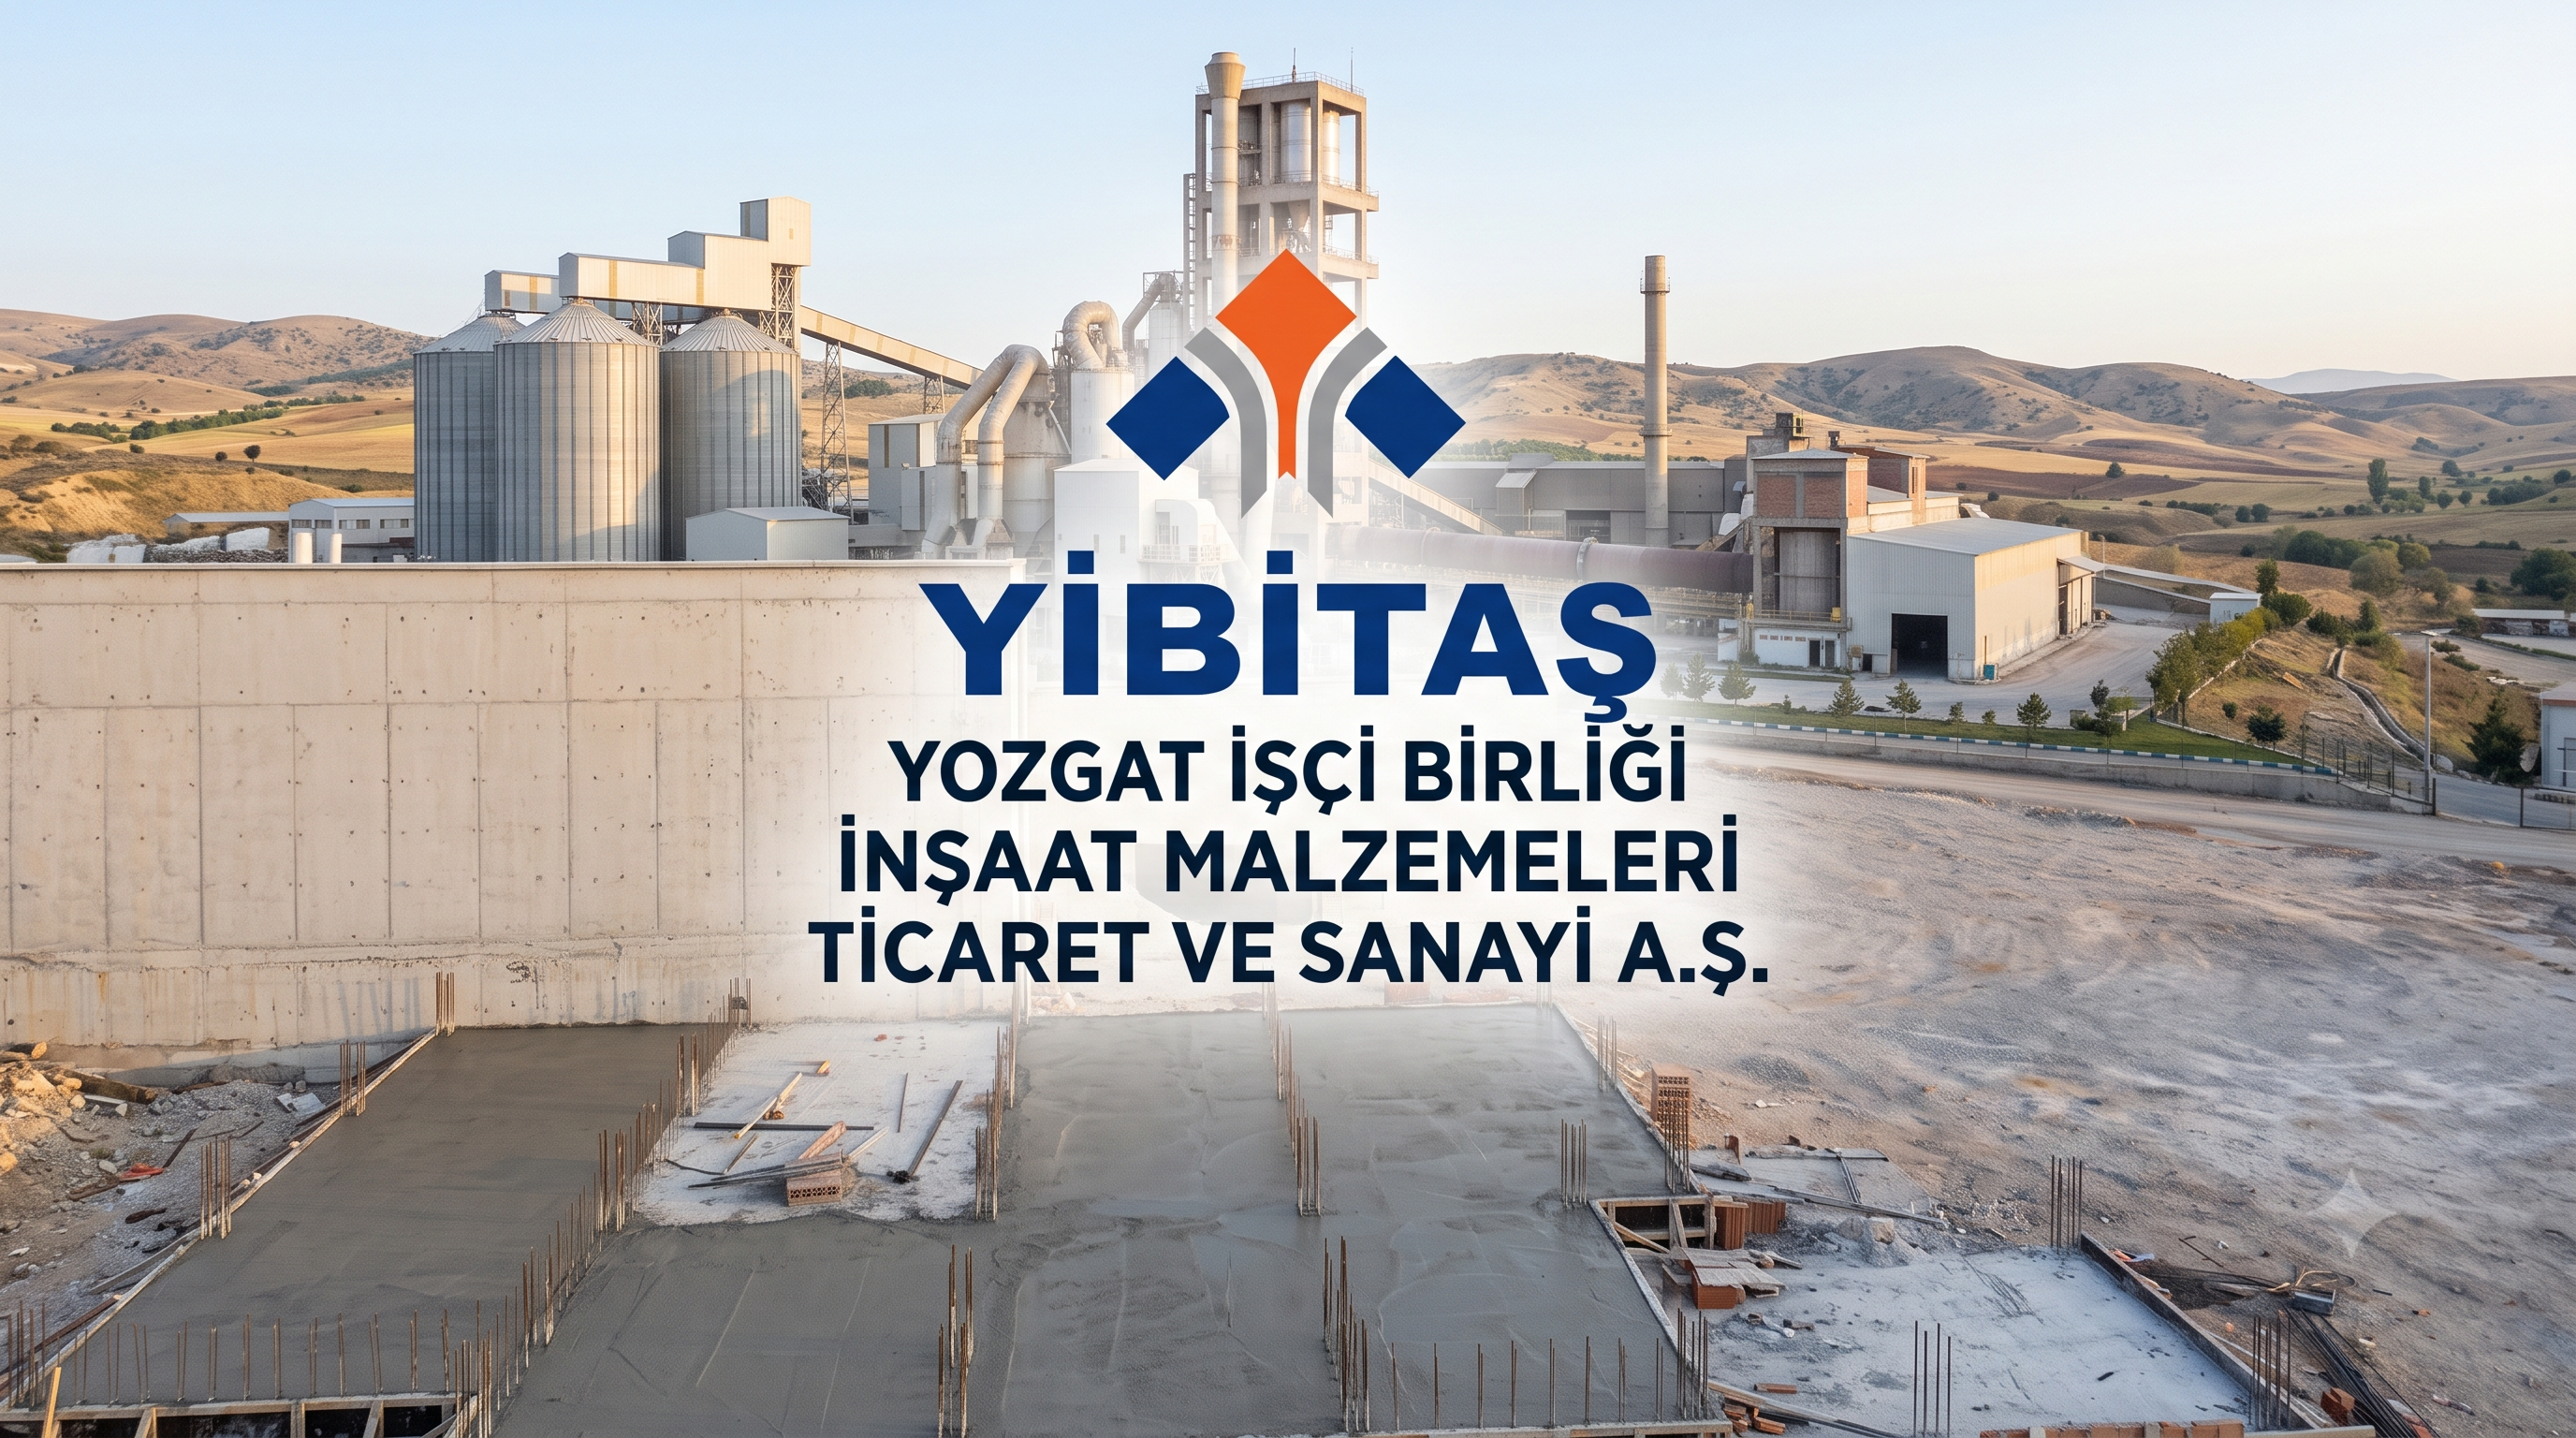
Since launching the site, this is my first opportunity to review a company outside of IPOs. Since I don’t know the company at all, while it won’t be as surface-level as my IPO overviews, it will still be a high-level review. If the financial metrics look solid and I like its business model, board of directors, and shareholders, I’ll dive deeper. Naturally, since this is just a starting point, I’m not entirely sure where this post will land by the end.
Company History and Ownership Structure
Taking a quick look at the company’s history, we see that it was founded in 1975. Following its acquisition in 2012 by Votorantim Cimentos—a major global player based in Brazil—the company went public that same year. Today, Votorantim Cimentos maintains its presence with an 80.69% stake.
Looking at the parent company, Votorantim Cimentos was established in 1933 in Brazil as part of a major conglomerate. It is a massive enterprise with around 200 facilities across various countries. While its core businesses are cement and ready-mix concrete, it also offers mortar and construction chemicals, agricultural lime, waste management, alternative fuels, logistics, and sustainable building solutions across four continents. After selling its assets in Morocco and Tunisia in 2025, the company continues to actively invest in Brazil, the US, Canada, Spain, Turkey, Argentina, Bolivia, and Uruguay.
Changes in Ownership Stakes
Looking at Yibitaş’s ownership breakdown, the parent company held an 82.96% stake from 2012 to 2024, with the remainder being publicly traded. Moving into 2025, we observe that the parent company, Votorantim Cimentos, made small share sales throughout the year. The motive behind these sales could be a broader exit strategy, or simply taking profits at high prices with plans to reaccumulate when the stock gets cheaper. Indeed, we’ve seen controlling shareholders trade their own stock before. Perhaps this is strategic, or maybe—much like their exit from Tunisia and Morocco—they decided to pull out of their Turkish investments in 2025. Unable to execute a block sale, they might be liquidating their position piece-by-piece on the open market, which doesn’t prevent the company from trading on the exchange. Following these sales, the parent stake decreased by 2.27 percentage points, dropping from 82.96% to 80.69%.
Reporting Transparency and Governance Structure
Another strange aspect of the company is that it releases only two financial reports and one year-end annual report per year. In other words, it discloses no quarterly reports whatsoever. I suppose such exemptions can exist in companies with high foreign ownership, but frankly, this is the first time I’ve encountered it.
The second issue is that the company’s website is downright awful. Aside from a few financial files from 2023, I couldn’t find any other documents on their site. The Turkey landing page is very weak; the announcement for the June General Assembly meeting is still sitting on the homepage, requiring you to scroll all the way down just to bypass it. Having it pop up every single time I refreshed the page was infuriating. Since I couldn’t locate the data on the site, I had to pull all the information directly from KAP (Public Disclosure Platform). This definitely earned a penalty point in my book.
Furthermore, I found zero information regarding management on the website. Accessing those details requires digging through annual or financial reports. Honestly, it’s fairer to say the company lacks a functional Turkish website altogether.
Board of Directors and Independence
The board of directors consists of two foreign and two Turkish members. Given that the controlling shareholder is a foreign institution, this structure is completely expected. When researching these individuals, I found no unusual or negative red flags online; they all appear to have technical expertise in their respective fields. The independent auditor opinions for 2024 and 2025 also indicate clean reports. While this isn’t 100% proof of flawless reliability, it provides a decent baseline.
However, it’s worth noting that the board is not independent, as its members are structurally tied directly to the parent company. As such, we cannot talk about an independent board. There are also serious issues on the public disclosure front. I view these shortcomings as systemic deficiencies rather than individual choices made by board members. Still, their lack of independence bears emphasizing; even if local management wanted to improve transparency, the parent company might not permit it.
Brazil isn’t all that different from Turkey when it comes to corporate governance standards. In fact, I recall plenty of instances in past years where democratic norms were trampled. The corruption present across almost all of Latin America can be seen there as well—even if I don’t think it’s quite as extreme as in some neighbors, the corporate culture of the owners’ home country still matters to us. Therefore, seeing corporate moves like asset liquidations similar to those in Turkey shouldn’t come as a surprise with Brazilian-owned companies.
After going public in 2012, the company paid regular annual dividends over the six-year period between 2013 and 2018. Dividend yields hovered around 2%, with a payout ratio kept near 20%. However, no dividend payments have been made since 2018.
The stagnation in net profit and the onset of growth bottlenecks during these years—alongside a steady loss of market share—likely played a role in cutting off dividends. The company fails to pass muster with me on this front. The absence of high dividend payout ratios commonly seen in foreign-backed companies raises serious questions about its cash-generation capacity.
Like any shareholder, owners expect to derive economic value from their investments. At the core of corporate acquisitions and capital expenditures is an expectation of returns. When shareholders fail to extract value—meaning no actual cash inflows reach their coffers—the sheer scale of fixed assets like plants, machinery, and vehicles isn’t enough on its own. Long story short, if the company had sufficient cash-generating power, I believe it would have continued distributing dividends.
The company has executed only a single bonus share issuance (stock split) to date. By carrying this out in September 2025 at a staggering rate of 299,900%, it proved—without exaggeration—why it sat at the top of stock market lists for “companies with high bonus share potential” for so many years.
Furthermore, when looking for analyst coverage or equity research notes, we find that despite being listed for many years and being well-known among investors, the company receives no analyst coverage or target price reports. In my own research, I couldn’t find a single target price report published by brokerage houses.
Operational Structure and Revenue Breakdown
The company’s current market cap stands at 4.251 billion TRY. We are dealing with a genuinely small company here—comparable in scale to the offering size of recent IPOs.
As the name suggests, its manufacturing facilities are located in Yozgat. Over 95% of revenue comes from cement sales. Sales aren’t made as ready-mix concrete; instead, clinker is converted into value-added bagged cement. Looking at its customer profile, it consists of cement dealers, building material vendors, and large construction project firms. It is fair to call it a pure-play cement company through and through. While it generates nominal revenue from transport and clinker sales, their contribution is negligible enough to ignore.
The 2025 revenue breakdown is as follows:
- Cement: 1.733 billion TRY (95.4% of total)
- Transport: 68.6 million TRY (3.8%)
- Clinker: 15.3 million TRY (0.8%)
Balance Sheet and Financial Condition Analysis
With a market cap of 4.251 billion TRY, its scale is quite small compared to other listed companies on Borsa Istanbul. Therefore, the evaluation needs to be framed with this scale in mind. I am reviewing the current H1 2026 financial report—a necessity since quarterly reports aren’t released. The company historically holds almost no cash; its current cash balance sits around 10 million TRY. Trade receivables stand at 379 million TRY against 546 million TRY in trade payables. Since payables exceed receivables, we need to inspect receivables and payables turnover periods. These metrics are crucial to understanding working capital and cash flow management in an inflationary environment. The receivables collection period is 59 days, while the payables payment period is 70 days. The 11-day gap works in the company’s favor, and I believe the 167 million TRY shortfall can be proportionally covered thanks to this timing advantage. That said, I want to add a footnote here: we must check the breakdown between related and non-related parties in trade payables. Looking at the figures, we see that the company borrows from related parties—namely its parent company—accounting for over half of its total trade payables.
Inventories have hovered between 300 million and 400 million TRY for years. Current assets feature a simple structure built mainly on trade receivables and inventory. Non-current assets follow a similar pattern, reaching 2 billion TRY due to inflation adjustments. Total assets stand at 2.750 billion TRY.
Short-term financial debt is virtually nonexistent. Trade payables have maintained a consistent trajectory over the years. There is no meaningful long-term debt burden either. Minor figures in certain line items aren’t large enough to disrupt the company’s financial structure. The company manages its cash flow primarily through its trade receivables and payables cycle—selling what it produces and converting it into cash.
Income Statement and Profit Margins
Following inflation adjustments, shareholders’ equity has reached 2 billion TRY. The balance sheet is straightforward—almost like a neighborhood grocery store—with no debt leverage, no cash reserves, and a simple model of selling what it manufactures.
Examining the income statement, revenue spiked to around 2 billion TRY alongside the high inflation environment of 2022. Although it hit 2.5 billion TRY in 2023, revenue generally runs around 1 billion TRY at H1 and roughly 2 billion TRY by year-end. Almost every year plays out as a carbon copy of the previous one. All sales are domestic, primarily focused in the Central Anatolia region.
Cost of goods sold appears to be stabilizing. While input and labor costs would normally be expected to rise in a 30% inflation environment, costs remaining flat has helped protect gross profit margins.
- 2023: Gross Profit Margin 19.75% | Operating Margin 5.72% | EBT Margin 6.27% | Net Profit Margin 22.60%
- 2024: Gross Profit Margin 14.97% | Operating Margin 1.47% | EBT Margin -2.52% | Net Profit Margin -6.64%
- 2025: Gross Profit Margin 26.46% | Operating Margin 9.78% | EBT Margin 2.00% | Net Profit Margin -3.90%
- H1 2026: Gross Profit Margin 25.89% | Operating Margin 12.35% | EBT Margin 11.95% | Net Profit Margin 10.89%
While the gross margin hovers flat in the 20-25% range, operating margin shows an improvement from around 5% to 12%. In prior years, other operating expenses driven by foreign exchange losses and commercial interest expenses were the primary drain on gross profits. Recently, we see a recovery here. However, due to its inefficient capital structure, the company posted net losses in 2024 and 2025, before showing signs of a bottoming-out pattern in H1 2026 as expenses dropped.
Looking closer at past financing expenses reveals that the bulk stems from interest on payables owed to the parent company and commercial interest charges. Under normal circumstances, a company with no bank debt shouldn’t run up financing costs on this scale. The heavy burden of other operating expenses and financial costs wiped out gross profits entirely, leading to losses two years in a row. Stripping away these items, normalized net profit for a company of this size could realistically sit around 100–200 million TRY—a non-trivial figure relative to its scale.
Sector Dynamics and Future Outlook
The rally in gold prices is making its presence felt in the construction sector and housing sales. Domestically, gains from gold investments—combined with relatively slower growth in real estate prices—boosted housing purchasing power. While this cushioned the company against steep revenue drops, I don’t expect aggressive top-line growth moving forward.
At its peak, the company hit 2.5 billion TRY in revenue and 558 million TRY in net profit. Given the current 25% gross margin profile and limited scope for capex/expansion, I project annual net profit to hover between 100 million and 300 million TRY at best. Because of a governance model that lacks corporate rigor and remains tightly intertwined with the parent company, its investment appeal remains quite weak. Factoring in years of stagnation—where top-line financial growth was largely an optical illusion driven by inflation—I see no growth catalysts or investment narrative here.
Cash Flow Analysis and Final Assessment
Looking at the cash flow statement, operating cash flow remains positive. The company produces, sells, collects, and maintains its cycle. It fits the profile of a business treading water—lacking growth targets, paying no dividends, and expanding equity purely through inflation adjustment.
Cash flow from investing activities sits at roughly -100 million TRY, which is reasonable considering plant maintenance, fleet replacement, and general repairs. The slightly negative cash flow from financing stems from lease obligations, though at just thousands of TRY, it’s practically negligible (and was zero in previous years). Cash balances have fluctuated between 10 million and 44.5 million TRY in recent years, mirrors of the rest of the balance sheet; since generated cash is consumed by internal operating costs, no lasting cash buffer builds up. As mentioned earlier, this missing cash flow can’t be channeled into expansion or returned to shareholders. The only beneficiaries here, fortunately, are the employees and corporate suppliers.
I see no reason to run a formal valuation model for this company. A business likely capped at 100–200 million TRY in annual net profit, generating little value-add, and offering no positive outlook hardly justifies a 4 billion TRY market capitalization. Even if one argues the current market cap is fair, the company’s long history of inaction toward shareholder value suggests more of the same ahead. Considering equity investing is inherently high-risk, I personally don’t find this risk worth taking in the case of Yibitaş.
For these reasons, I wrap up this analysis of Yibitaş and conclude that, given its current outlook, investing in the company isn’t something I personally consider viable.
LEGAL DISCLAIMER: This content does not constitute investment advisory services. Investment advisory is a personalized service provided based on an individual’s risk-return profile, financial standing, and investment objectives. The information, commentary, and assessments provided herein are prepared solely for general informational purposes and should not be construed as investment recommendations or guidance. This content may not align with the reader’s financial position or risk-return preferences; therefore, investing based solely on this information may not yield the expected outcomes.