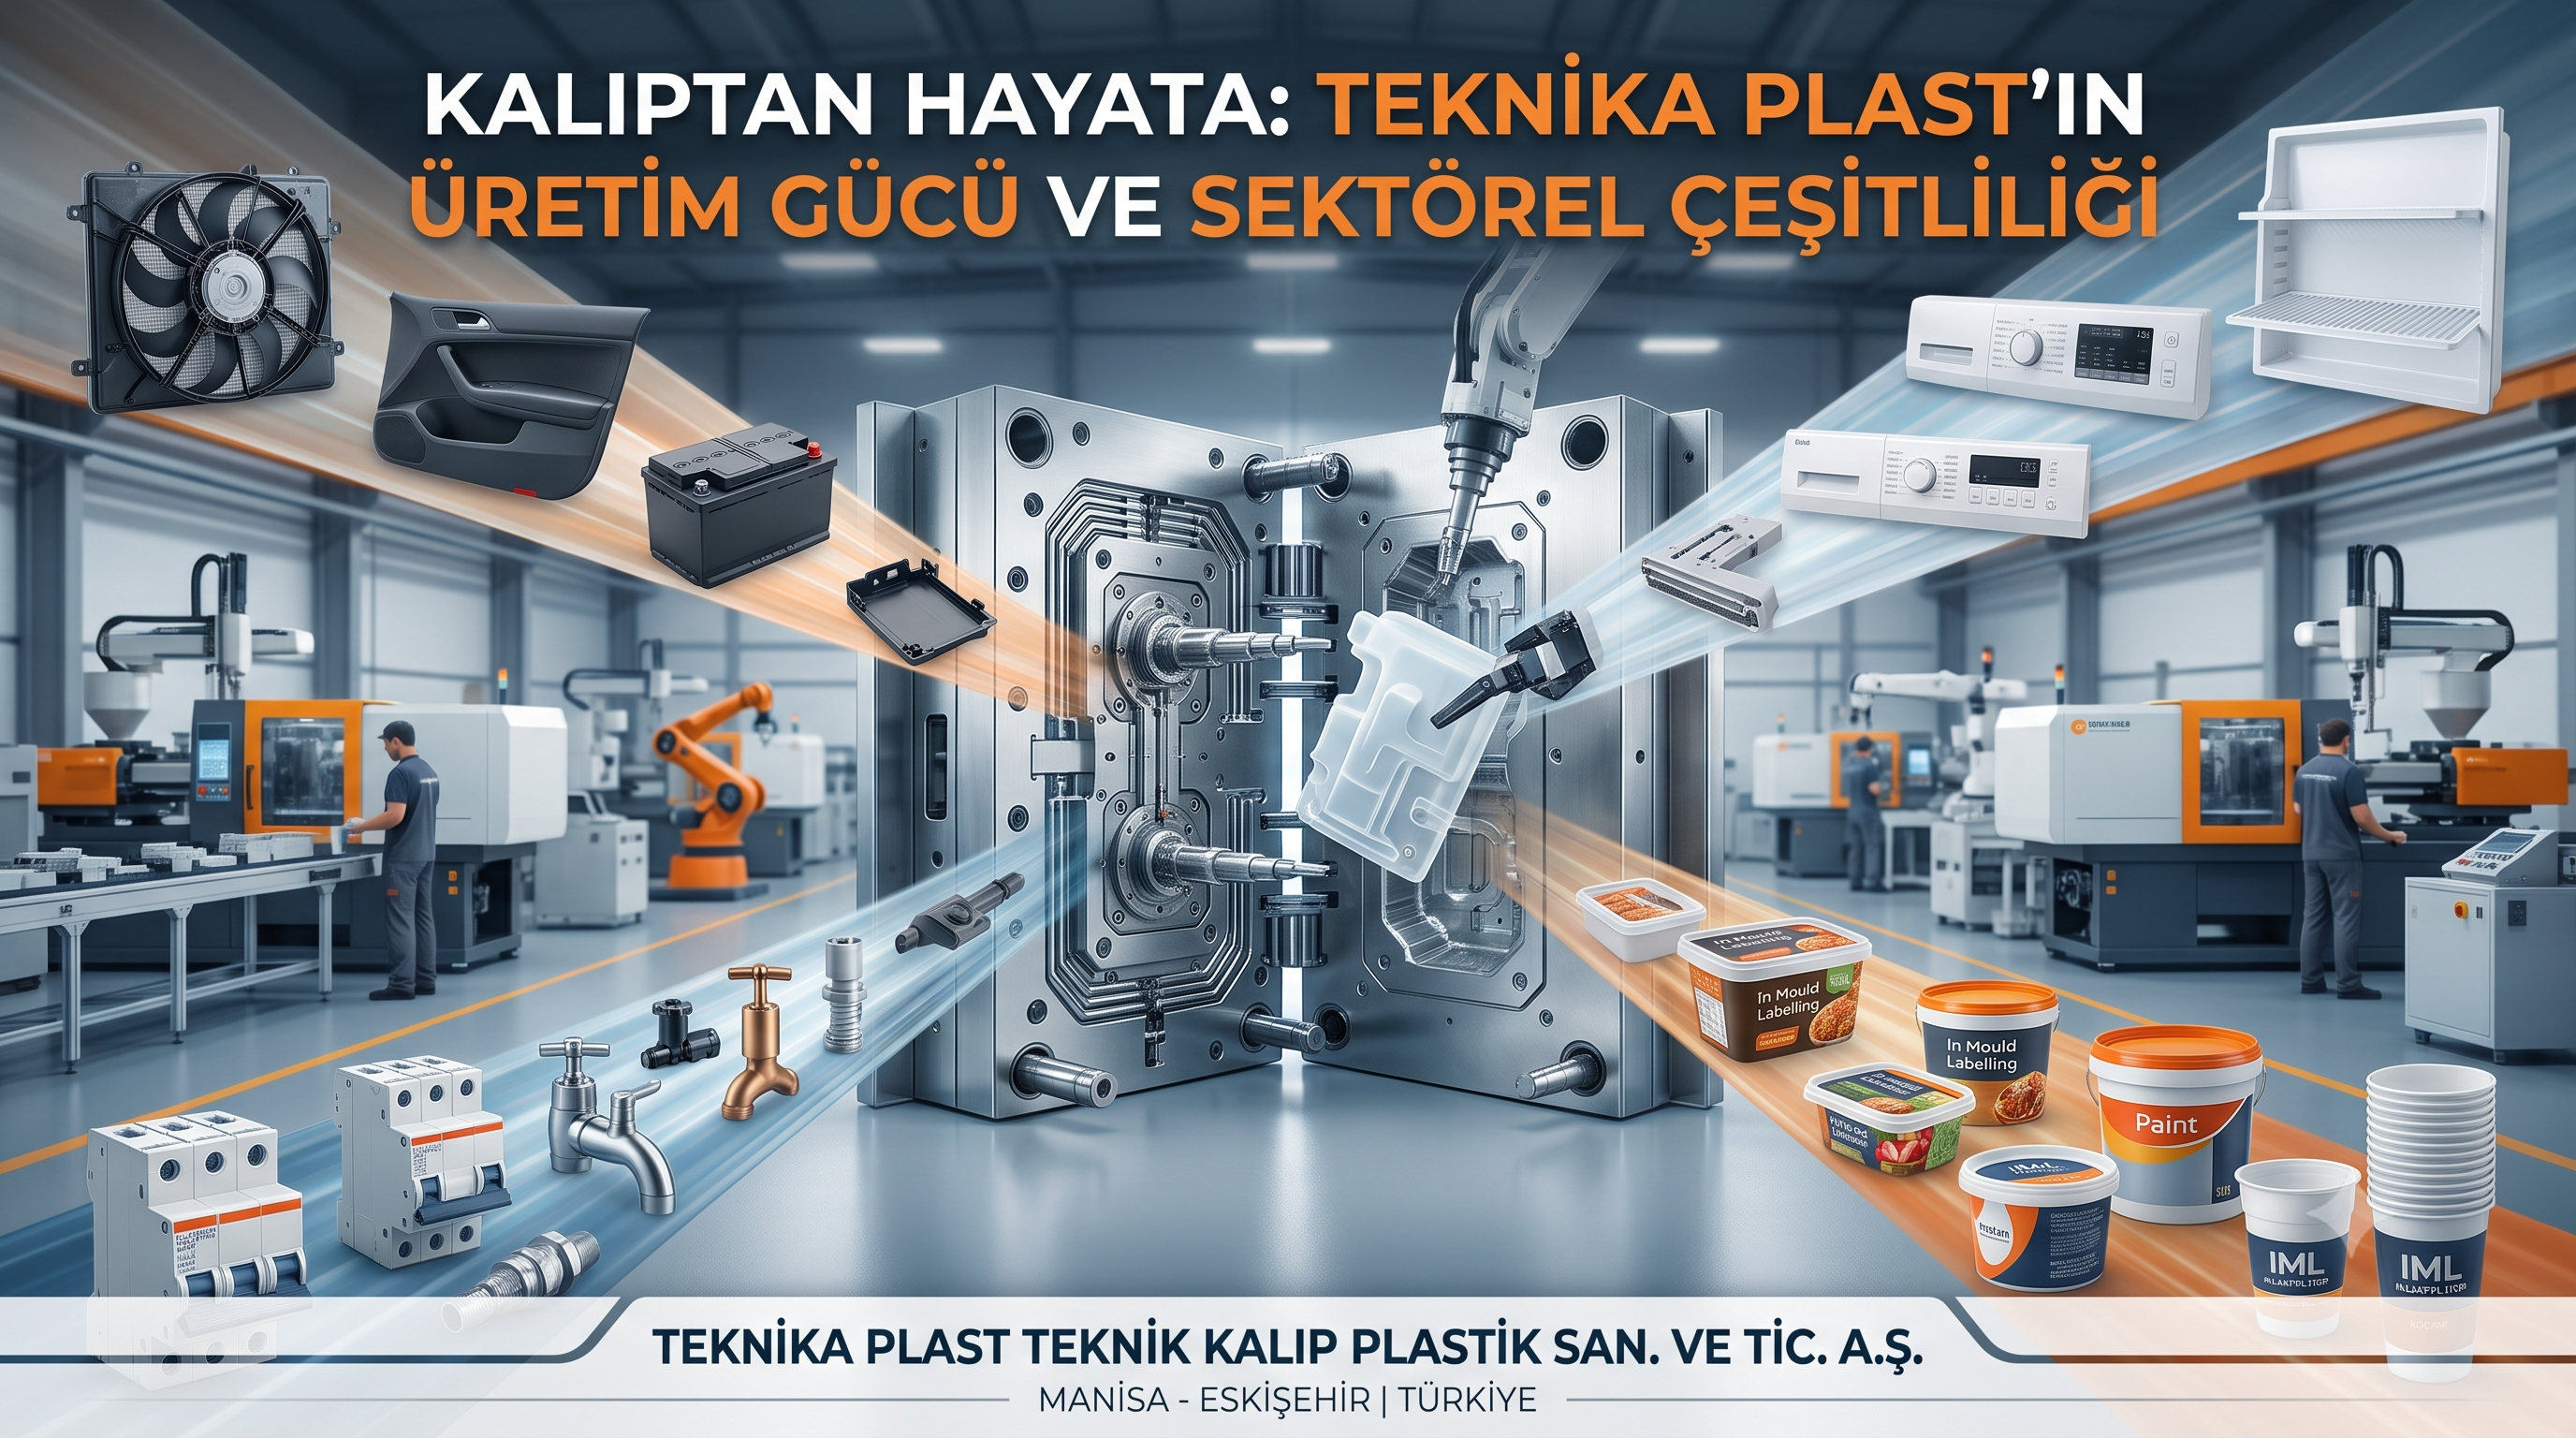
When looking at the company’s business model, we see two main areas of activity. The first is the packaging sector. Teknik Plast manufactures rigid plastic food packaging as well as white goods and industrial plastic packaging. The second area, which can be considered the company’s higher-value segment, is plastic injection and mold manufacturing. The company designs plastic injection molds in-house according to customer demands and operates as a plastic injection and mold manufacturer, particularly for the white goods sector.
We haven’t seen an IPO from a new company in the packaging sector in recent years. To be frank, since I don’t particularly care for the packaging sector, I don’t have detailed knowledge about it; because my knowledge is limited, I generally avoid companies in this industry. However, looking at the big picture, we can say that Teknika Plast will become the largest player in the packaging sector following its IPO. The company is being offered at a market capitalization of approximately 10,675 billion TL. It is also fair to say that the state of publicly traded packaging companies in recent times isn’t particularly bright. We see that most companies are loss-making, while those making a profit trade at quite high valuations. Although firms in the sector are generally small-scale, they are priced at high multiples in the market.
IPO Details and Ownership Structure
Looking at Teknika Plast’s IPO structure, we see that 25 million shares are being issued through a capital increase, while 6 million shares are being sold by existing shareholders. The free float ratio stands at approximately 25%, with a price stabilization period set at 15 days. With this setup, the company’s IPO size reaches roughly 2.6 billion TL. The prospectus states that funds raised from the shareholder sale will be used during the 15-day price stabilization process. This is a positive step toward protecting retail investors. The fact that the majority of the offering is conducted via a capital increase—and that these funds will go directly into the company’s treasury—is another positive aspect of the IPO structure.
Examining the company’s ownership structure, we see a family/promoter-owned business founded and managed by two partners. Prior to the IPO, Kemal Yaralı and Ali Kutay Yaralı each held an equal 50% stake in the company. With 3 million shares sold by each partner in the offering, the equal ownership structure is maintained, while the net free float ratio settles at 24.80% post-IPO.
Pre-IPO ownership structure:
Kemal Yaralı → 37,6% Ali Kutay Yaralı → 37,6%
Post-IPO net free float ratio → 24.80%
Facilities and Investment Plans
We can examine the company’s facilities in four main categories: packaging facilities, industrial production facilities, SPP (Solar Power Plant) investments, and investment properties. On the packaging side, there is an active production facility in Manisa, while a second packaging plant currently under construction in Manisa is scheduled for completion in June 2027. With this investment, the company aims to double its existing packaging production capacity. Considering the current capacity utilization rate in packaging, this investment appears quite crucial for the company’s future.
On the industrial side, there are two production facilities, located in Manisa and Eskişehir. Looking at renewable energy assets, we see two different investments. The SPP facility in Manisa became operational in May 2025 and has started generating sales revenue. The plot of land in İzmir was purchased to meet the electricity needs of the Eskişehir factory, but it has not yet been converted into an SPP facility or brought online. Therefore, the company currently has only one active SPP plant generating commercial electricity sales revenue.
Use of IPO Proceeds
The net proceeds from the IPO entering the company’s coffers are expected to be 2.056 billion TL. According to the plan disclosed by the company, 40% of these funds will be allocated to working capital, 30% to investment financing, and the remaining 30% to paying down financial debt. Under investment financing, the plan includes completing the new plant construction in Manisa, purchasing 60 new machines, doubling food packaging production capacity, and evaluating alternative investment opportunities, including potential acquisitions.
Use of proceeds plan declared by the company:
40% → Working capital 30% → Investment financing 30% → Financial debt repayments
While the allocation in the official prospectus looks like this, as I have often noted in previous articles, I lean toward the view that the portion allocated to working capital will practically serve to reduce debt. Therefore, I view the actual use of the IPO proceeds as roughly 70% debt reduction and 30% investments. Given that the Manisa investments stem from past financing needs and the acquisition option is left quite vague, it is hard to say that the presented plan represents a high-quality investment strategy. The most positive takeaway here is that packaging capacity will be doubled with the purchase of 60 new machines. The uncertainty in the other items reinforces the impression that the company’s primary motivation for the IPO is to lighten its debt burden.
Sales Performance and Capacity Utilization Rates
When evaluating the company’s sales performance, I focus directly on revenue items. In the overall sales trend, a decline catches the eye, much like in other companies in the sector. Looking into the details, we see that packaging sales have remained flat over the years, while industrial sales have dropped noticeably. Given that the company’s industrial sales are heavily tied to the white goods sector, the drop in sales for this segment is understandable alongside the contraction in that industry. Meanwhile, with the SPP coming online in May 2025, a new revenue line item has begun contributing to the company, though it remains quite small in scale.
Net Sales by Operating Segment
Packaging Sales
2023 → 2.039 billion TL · 2024 → 2.080 billion TL · 2025 → 2.215 billion TL · 2026/Q1 → 549 million TL
Industrial Sales
2023 → 4.801 billion TL · 2024 → 4.840 billion TL · 2025 → 3.546 billion TL · 2026/Q1 → 491 million TL
SPP Revenues
2023 → — · 2024 → — · 2025 → 4.2 million TL · 2026/Q1 → 3.7 million TL
Total Net Sales
2023 → 6.839 billion TL · 2024 → 6.921 billion TL · 2025 → 5.765 billion TL · 2026/Q1 → 1.044 billion TL
One of the important metrics to consider when evaluating investment decisions is the capacity utilization rate. On the packaging side, the capacity utilization rate, which stood at 94% in 2023, came in at 91% in 2025 and the first quarter of 2026. Evaluated alongside the slight uptick in packaging revenue, it is clear that the company continues to operate at very high capacity in this segment despite the tight monetary policy environment. Therefore, the investment aimed at doubling existing production capacity has a solid operational rationale.
Packaging capacity utilization rate:
2023 → 94% · 2025 → 91% · 2026/Q1 → 91%
On the industrial side, however, the picture is quite grim. Due to the slowdown in the white goods sector, the capacity utilization rate—which was at 94% in 2023—dropped all the way down to 25% as of the first quarter of 2026. Shifting the investment focus to the packaging segment in response to this contraction on the industrial side can be viewed as a strategically sound decision. With capacity utilization in packaging still at 91%, doubling production capacity could provide the company with significant growth potential, especially as interest rates begin to fall and monetary tightening starts to ease. I believe this packaging investment is the most positive element in the company’s story.
Industrial capacity utilization rate:
2023 → 94% · 2026/Q1 → 25%
Balance Sheet Analysis
Examining current assets on the balance sheet, we see that cash and cash equivalents have declined noticeably to 325 million TL. Including financial investments, the company holds approximately 700 million TL in liquid assets. Adding roughly 1 billion TL in trade receivables and 686 million TL in inventory brings total current assets to approximately 2.65 billion TL. The decline in current assets from around 4 billion TL in 2023 to 2.65 billion TL indicates that the company has recently struggled with cash management.
Key items in current assets:
Liquid assets → ~700 million TL Trade receivables → ~1 billion TL Inventory → 686 million TL Total current assets → ~2.65 billion TL
Against its roughly 1 billion TL in trade receivables, the company has about 800 million TL in trade payables. While this structure looks balanced at first glance, turnover ratios must also be taken into account. Days sales outstanding (DSO) stands at 90 days, while days payables outstanding (DPO) is at 83 days. Although the 7-day gap is manageable on its own, the real point of concern is the deterioration in the cash conversion cycle. The company’s cash conversion cycle has lengthened from 21 days in 2023 to 75 days currently. This deterioration put severe pressure on net working capital, which plummeted from 485 million TL in 2023 to around 5 million TL currently. This sharp contraction in working capital has been one of the primary drivers behind the company’s increased need for additional financing and debt.
Cash conversion cycle:
2023 → 21 days · Current → 75 days
Net working capital:
2023 → 485 million TL · Current → ~5 million TL
Total non-current assets appear to be around 5.5 billion TL, of which approximately 1.7 billion TL consists of right-of-use assets. Since this accounting item arising from leases ultimately creates cash outflows, I limit its impact on non-current assets in my analysis.
Financial Debt Structure
Total bank loans stand at approximately 2.656 billion TL. Total short-term liabilities amount to roughly 2.6 billion TL, consisting of 1.7 billion TL in financial debt and around 800 million TL in trade payables. Of the 1.7 billion TL in short-term financial debt, about 700 million TL comes directly from short-term loans, while the remaining ~1 billion TL stems from current portions of long-term debt due within the year.
About 1.050 billion TL of long-term liabilities consists of bank loans, with the remainder mostly driven by lease liabilities. Looking at the evolution of debt over time, we see that the company reduced its short-term financial debt from 2.468 billion TL in 2023 to 1.700 billion TL, whereas its long-term debt rose from 847 million TL to 1.570 billion TL over the same period. Thus, while the company managed to lower its short-term debt, a significant portion of it was effectively shifted into longer maturities. Recent cost increases and declining sales have made managing this debt structure considerably more challenging.
Short-term financial debt:
2023 → 2.468 billion TL · Current → 1.700 billion TL
Long-term debt:
2023 → 847 million TL · Current → 1.570 billion TL
Income Statement and Profit Margins
Looking at the income statement, we see that despite declining revenue, the company has managed costs quite effectively. The gross profit margin rose from 14.09% in 2023 to 17.49% in 2024, and 17.53% in 2025. The gross margin of 16.11% in the first quarter of 2026 shows that cost control remains largely intact. While operating profit margins show a similarly resilient outlook, net profit margins remain suppressed at very low levels due to high financing costs.
Profit Margin Development
Gross Profit Margin
2023 → 14.09% · 2024 → 17.49% · 2025 → 17.53% · 2025/Q1 → 10.46% · 2026/Q1 → 16.11%
Operating Profit Margin
2023 → 9.56% · 2024 → 13.26% · 2025 → 11.46% · 2025/Q1 → 5.99% · 2026/Q1 → 13.71%
Net Profit Margin
2023 → 13.64% · 2024 → 2.38% · 2025 → 2.30% · 2025/Q1 → 1.61% · 2026/Q1 → 1.70%
Segment-level margins become even more crucial when trying to understand the company’s investment strategy. The gross margin in the packaging segment stands at around 27%, compared to roughly 14.5% in the industrial segment. The significantly higher gross profit margin in packaging indicates that shifting investment focus to this side makes sense not only in terms of capacity utilization but also profitability. Combining high capacity utilization with superior gross margins makes the packaging investments the cornerstone of the company’s growth story.
Impact of Financial Expenses on Profitability
While cost control on the operational side is successful, the company’s high financial expenses severely weigh on profitability. Despite generating 660 million TL in operating profit and 47 million TL in income from investment activities in 2025, the company posted roughly 750 million TL in financial expenses. Thus, financing costs virtually wiped out all profits from core operations. This clearly shows that even though the company generates operational profits, the main barrier to translating them into net income is its debt load and financing costs.
One key reason the company has still managed to report net profit is the net monetary position gain recognized under inflation accounting. Driven by high debt levels and inventories, the net monetary gain item provided a positive contribution. In the latest balance sheet, the company reported approximately 181 million TL in net monetary position gain, with 430 million TL originating from the inflation adjustment of property, plant, and equipment, and about 43 million TL from inventories. As a result of these adjustments and tax items, the company closed 2025 with a net profit of 132 million TL and reported 17 million TL in net profit for Q1 2026. Therefore, under current conditions, financing costs—rather than operational profitability—dictate the company’s bottom line.
Net profit:
2025 → 132 million TL · 2026/Q1 → 17 million TL
Overall Assessment
As I’ve noted in previous reviews, I prefer not to make sizable investments in newly listed companies because we cannot monitor management quality or the fulfillment of IPO promises over time. I write these analyses primarily to keep a pulse on the market and follow companies post-IPO. Since I believe the balance sheet and income statement reveal the company’s financial structure clearly enough, I don’t feel the need to dive into the cash flow statement separately.
Looking at the big picture, Teknika Plast is navigating a challenging climate due to high interest rates and a contraction in the white goods sector, which accounts for roughly 60–70% of its revenue. That said, management appears to be handling this period relatively well through tight cost control and high capacity utilization in packaging. Maintaining strong capacity utilization in packaging despite the sharp downturn in industrial sales—and pivoting investment toward this higher-margin segment—can be considered a smart move under current conditions.
One of the most significant positive developments for the company is the potential to substantially reduce its debt burden post-IPO. The company is directing roughly 1.440 billion TL from IPO proceeds toward debt repayment. Adding the company’s existing liquid assets of ~700 million TL brings total available resources to approximately 2.140 billion TL. This amount is large enough to easily bring short-term financial debt of ~1.7 billion TL under control. As the debt burden eases, the pressure from high financial expenses should lighten. Especially in an environment of ongoing rate cuts, declining financing costs could offer major relief to net profitability.
Valuation Commentary
While the packaging investment creates a strong growth story on the operational side, a major caveat is needed when it comes to valuation. Let’s assume the company doubles its current packaging capacity and packaging revenue rises from ~2.3 billion TL to 4.6 billion TL. Calculated at a 25% gross profit margin, this segment could generate roughly 1.272 billion TL in gross profit. While this scenario demonstrates significant operational growth potential, we must also consider how much of this future growth is already priced into the current valuation.
I find the company’s current market cap of approximately 10,675 billion TL—even factoring in a 20% IPO discount—prospectively quite high. Considering the slump in the white goods sector, the sharp fall in industrial capacity utilization, high financing costs, and tight monetary policy, I believe today’s valuation already prices in a substantial portion of future expectations well before growth investments fully kick in. While I like the packaging strategy, high capacity utilization, and strong segment margins, I don’t find the current pricing nearly as attractive.
In my estimation, the company’s fair value should be roughly 40% below the current valuation.
For these reasons, I believe Teknika Plast has a growth story worth following operationally, particularly in the packaging segment. Reducing debt, lowering financing expenses, and bringing new packaging capacity online could boost financial results over the coming period. However, the current IPO valuation already factors in much of these optimistic expectations. Therefore, while I view the company’s operational structure and future potential favorably, I consider it expensive from a valuation standpoint at the current IPO price.
LEGAL DISCLAIMER: This content does not constitute investment advisory services. Investment advisory is a personalized service provided based on an individual’s risk-return profile, financial standing, and investment objectives. The information, commentary, and assessments provided herein are prepared solely for general informational purposes and should not be construed as investment recommendations or guidance. This content may not align with the reader’s financial position or risk-return preferences; therefore, investing based solely on this information may not yield the expected outcomes.