Lately, we’ve been seeing an excessive number of companies going public. While this creates a volume issue for the stock market as a whole, it doesn’t pose much of a problem for me personally or for the companies I invest in. Sure, stock prices are dropping or staying range-bound for extended periods. However, because I approach investing from a different perspective, this doesn’t directly hit my bottom line as a loss.
What actually makes me happy is seeing companies operating in more niche fields, like Kapeks Kimya, start to go public. I view it as a very positive development that companies from diverse business lines are joining Borsa Istanbul, alongside sectors like banking, real estate, and energy, which have dominated the market for a long time.
To expand a bit on why this matters: Borsa Istanbul has been treading water in real terms for quite some time. In periods like this, having companies operating in distinct, niche sectors on the exchange allows us to catch opportunities independent of the general market direction, essentially creating a built-in hedging mechanism within the portfolio. For instance, being able to take positions in high-quality insurance companies while the automotive sector is going through a slump gives you a chance to move counter to broader market headwinds. This provides a significant advantage for generating positive real returns, especially in a market environment that has remained flat and weak in real terms for so long.
Company Business Model
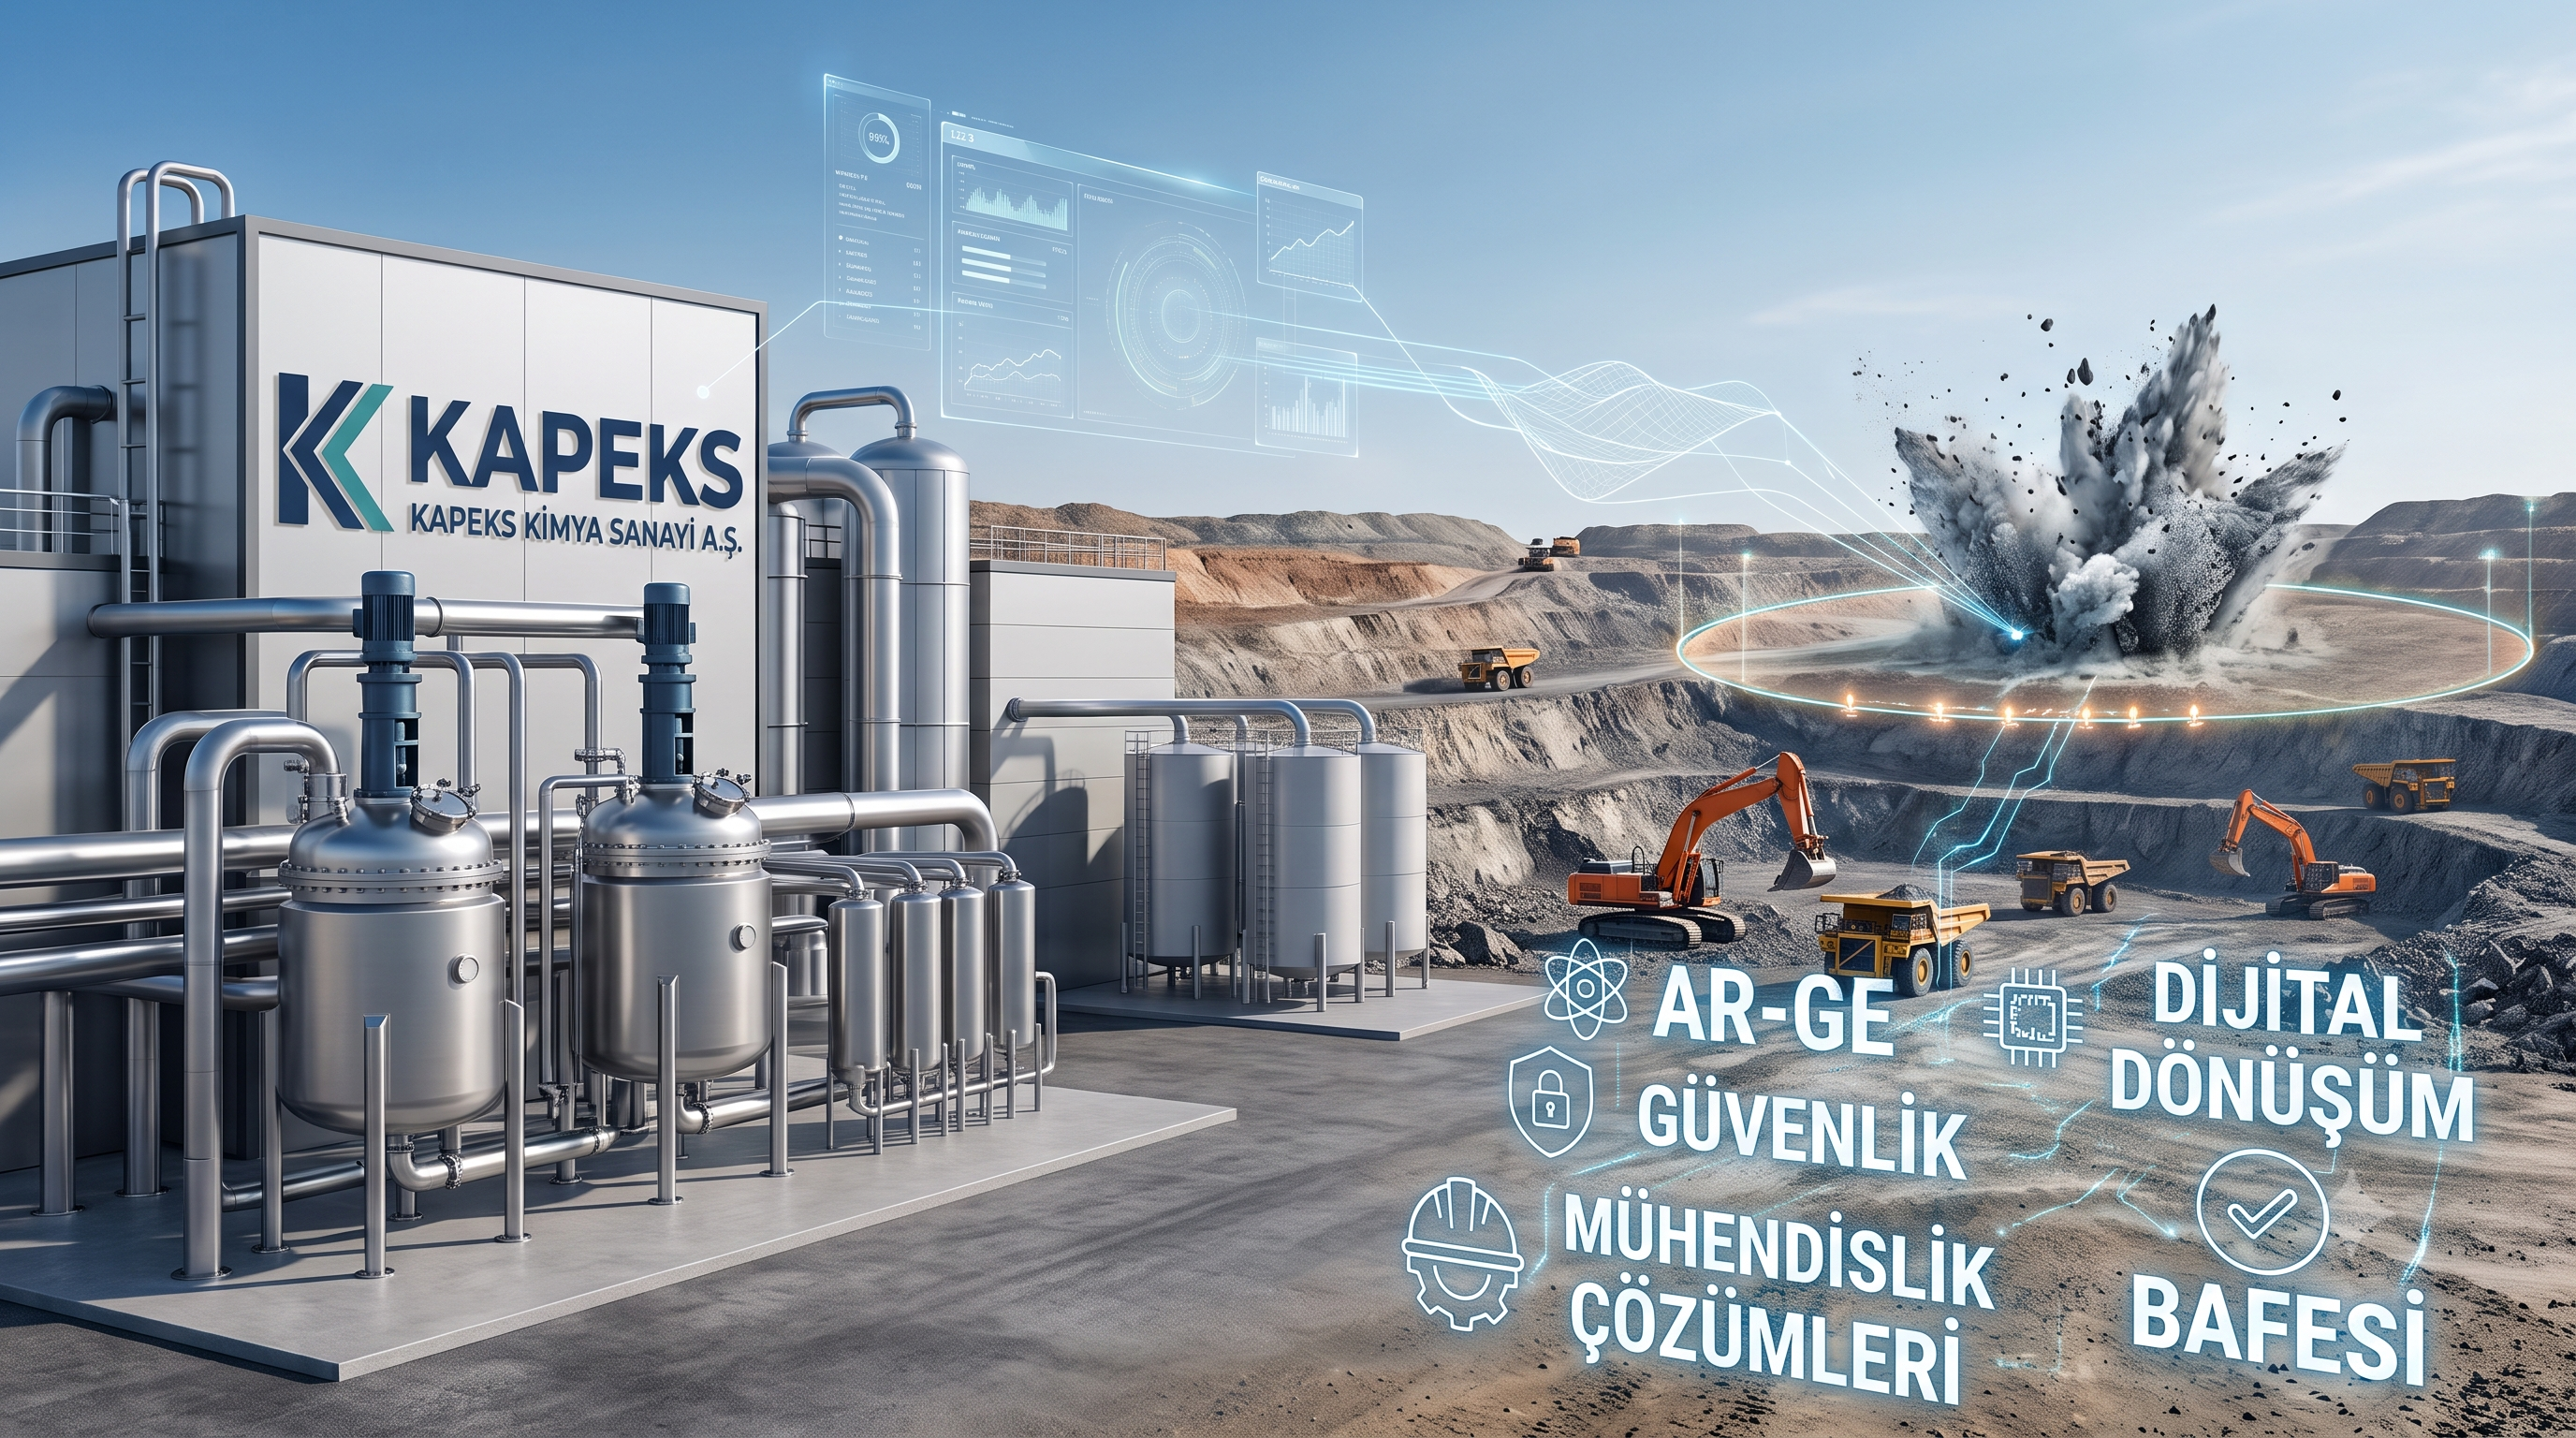
When looking at Kapeks Kimya’s business structure, we can basically say that it operates in the commercial explosives industry. Since I figure this is an unfamiliar area for myself and many others, I felt the need to break down the specific fields and business lines the company operates in. I wanted to get a detailed grasp of this myself while analyzing the company.
First, there’s the manufacturing and sales of explosives. Second is blasting and engineering services. The goal here is to provide drilling and blasting services to clients in the mining, cement, and quarrying industries, along with engineering services such as blast design, optimization, and auditing. In short, the company both produces the explosives and provides services during the blasting phase.
The company also offers logistics services. Through its subsidiary, Adreks Lojistik, it handles the safe shipping and transportation of explosive materials. Because explosives involve a hazardous process from production all the way to transport, having the production and distribution network integrated as much as possible is something I genuinely like about their business structure.
Finally, there’s the power generation side, which we see in so many companies these days.
Fleshing out these four main business lines a bit more, as you might expect, the explosives and blasting segment forms the core of the business. Roughly 98% of revenue—virtually all of it—comes from explosive manufacturing, sales, and engineering services. Logistics and the solar power (GES) side make up the remaining 2% to 2.5%.
IPO Structure and Shareholder Base
The fact that there are no secondary share sales in the IPO, with all ~25 million shares being issued through capital increase so that the raised cash goes straight into the company’s treasury, is a very strong positive sign in terms of the shareholders’ commitment.
Another decision I find encouraging is the price stabilization mechanism. For 15 days post-IPO, if the share price dips below the offer price, up to 20% of the gross IPO proceeds can be used for share buybacks to support the price. This signals the partners’ confidence in their own business, which I view very favorably.
Similarly, I consider the post-IPO free float remaining at around 20% to be a positive. While I’ve noted in previous articles that I consider a 10–15% range ideal, given the company’s scale and financing needs, a 20% float strikes me as a reasonable upper bound and an ideal level for this specific company.
Looking at the shareholder structure, however, we see a remarkably fragmented base—something we haven’t seen in IPOs for quite a while. Granted, there are controlling shareholders, but in my view, the number of partners is quite high.
- Hakan Kaya: 15.39%
- Müfit Erdil: 15.39%
- Hasan Hatunoğlu: 15.39%
- Gökhan Aydın: 9.08%
- Berrin Hatunoğlu: 7.70%
- Haluk Salgır: 3.30%
- Ayşe Arkan: 2.89%
- Fuat Burtan Arkan: 2.89%
- Metehan Derya: 2.00%
- Ümit Kılıç: 2.00%
- Velat Alabaş: 2.00%
- Ferhan Arkan: 1.92%
- Publicly Traded Shares (New Shareholders): 20.06%
Since voting rights are heavily concentrated among the top three individuals, one might assume corporate governance won’t suffer directly. Still, having this many shareholders gives me my first real negative impression. Too many voices can drag out decision-making with unnecessary bureaucracy and also opens the door to potential nepotism. For these reasons, I frankly view this crowded shareholder table as a drawback.
Use of IPO Proceeds
- 40–50%: Domestic and international investments in new production facilities and warehouses, as well as evaluating alternative investment opportunities.
- 50–60%: Working capital.
Looking at the allocation of proceeds, roughly 40–50% is earmarked directly for growth-oriented investments. This includes establishing or acquiring new production facilities and warehouses at home and abroad, pursuing alternative investment opportunities based on market conditions, modernizing current production lines, and launching operational projects to expand capacity. Allocating this portion to investments that bolster the company’s production capacity and technological infrastructure is definitely a net positive in my book.
The remaining 50–60% is slated for working capital and raw material procurement. However, frankly, bundling these two items into a single range feels like taking the easy way out. While working capital and raw material purchasing are linked, they address different needs, and the company itself knows its debt, cash flow, and inventory structure best. I would have preferred to see a distinct breakdown for working capital and a separate one for raw material supply or inventory buildup. Even though operational financing and raw material procurement are listed separately under sub-headings, omitting a clear percentage breakdown for each feels like a gap to me.
Balance Sheet
Now that we have a general understanding of the company structure, shareholder setup, and intended use of proceeds, let’s dive into the financials. As usual, we start with current assets on the balance sheet. Cash and cash equivalents have remained largely flat over the years, while trade receivables hover around 1 billion TRY. Inventories show a downward trend over time, declining from roughly 555 million TRY to 400 million TRY. Out of total current assets of around 2 billion TRY, roughly 400 million TRY consists of cash, 1 billion TRY of trade receivables, and 400 million TRY of inventory. Given the drop in inventory levels, setting aside 50–60% of the IPO proceeds for working capital seems like a sensible move at first glance.
When assessing trade receivables, we naturally have to look at them alongside trade payables. The company has around 490 million TRY in trade payables, meaning receivables are roughly double payables—a positive sight on the surface. But as always, we can’t just look at absolute balances; we need to see how quickly those balances turn into cash or get paid out. Receivables collection averages around 90 days, whereas trade payables must be paid within about 30 days. Inventory turnover also fluctuates between 30 and 90 days depending on the period. So while the company takes about 90 days to collect receivables, it pays off its debts within 30 days. Even though having twice as many receivables as payables looks good on paper, this maturity mismatch presents a significant disadvantage for cash flow management. Therefore, I don’t think it’s fair to treat that initial positive impression as a major win based solely on balance totals.
Debt Structure
Turning to liabilities, short-term liabilities stand at around 763 million TRY. Approximately 110 million TRY of this consists of financial debt such as bank loans, while trade payables make up most of the remainder. On the long-term side, there is no significant financial debt to speak of; the main item here is a deferred tax liability of roughly 193 million TRY.
I’ve touched on taxes in previous company write-ups, but I’ll briefly restate my approach here. Since tax liabilities are intimately tied to accounting treatments, I don’t treat them in the exact same light as interest-bearing financial debt. Accounting elements like expenses, depreciation, and VAT rollforwards can reduce or eliminate these liabilities over time—as I’ve seen firsthand—so unless they reach absurd levels relative to the company’s size, I don’t overweight them in my valuation.
I take a similar view toward fixed assets in the current market environment. At a time when cash flow is paramount, the sheer size of a company’s fixed assets doesn’t mean much on its own. We see plenty of examples where a company with 2 billion TRY in non-current assets generates far more cash and profit than one with 100 billion TRY. That’s why I prefer focusing on how much cash and profit a company can extract from its assets rather than how many assets sitting on the books. Of course, if macroeconomic conditions shift, fixed asset backing could regain importance in valuation.
Taking all these items together, it’s fair to say the company’s leverage profile is quite solid. Trade receivables alone are almost enough to cover a substantial portion of short- and long-term liabilities, presenting a strong balance sheet picture. Especially in a market where heavy debt burdens have become a nightmare for many firms, keeping financial debt so limited is a huge plus.
Income Statement
Moving on to the income statement, in contrast to the clean balance sheet, we see a noticeable weakening in revenue. Over the years, top-line revenue has dropped from around 5.3 billion TRY down to 3.8 billion TRY. Looking at the latest quarterly figures, the bottoming-out trend starting to surface in some other companies hasn’t materialized for Kapeks Kimya yet. Quarterly revenue slid from roughly 850 million TRY to 794 million TRY, maintaining its downward trend.
However, judging revenue decline in isolation would be misleading. Because the company also managed to trim costs over the same period, what we really need to track is how profit margins evolved.
Profit Margin Type → 2023 | 2024 | 2025 | 2025 First 3 Months | 2026 First 3 Months
Gross Profit Margin → 38.18% | 33.09% | 32.15% | 27.18% | 31.49%
Operating Profit Margin → 27.16% | 15.82% | 14.08% | 11.87% | 12.51%
Profit Before Tax Margin → 17.44% | 6.77% | 7.34% | 3.08% | 7.95%
Net Profit Margin → 10.72% | 3.91% | 3.20% | -0.51% | 4.51%
Looking at the margins, gross margin has held up relatively well despite the notable drop in revenue. A gross margin in the 30–40% range is genuinely impressive in my view. Given the nature of their business and sector dynamics, this might not come as a total surprise, but looking internally, it shows cost management held up reasonably well despite top-line contraction.
What interests me more is the movement in operating profit margin. Dropping from 27% in 2023 down to the 12–14% range in subsequent periods signals a serious operational contraction. That said, seeing the margin edge up from 11.87% to 12.51% in the first quarter of 2026—and holding double-digit territory on the operating front—is a positive sign.
Moving further down the income statement below operating profit, we see that financial expense remains manageable thanks to low leverage. On the flip side, net monetary position gain/loss significantly impacts the spread between operating profit and net profit. Therefore, rather than taking the bottom-line figure at face value, we need to inspect what actually drives this net monetary position loss.
My Take on Net Monetary Position Gain and Loss
I recently read a post by someone I follow closely on Twitter—someone I respect immensely and have learned a lot from—arguing that net monetary position gain/loss should be factored into company valuations. That piece was directed against folks like me who believe this line item shouldn’t drive valuation decisions. I happen to disagree with that stance. So without getting bogged down in overly technical jargon, I’d like to explain why I view net monetary position gain/loss differently and why I largely set it aside in this company’s case.
In the latest financial report, we can see where the net monetary position impact originates, on both the positive and negative sides:
-
Impact of Non-Monetary Assets: +138,651,296 TRY
- Property, Plant, and Equipment: 134,420,009 TRY
- Inventories: 11,937,954 TRY
- Deferred Tax Asset: -25,130,575 TRY
-
Impact of Non-Monetary Liabilities and Equity: -271,067,367 TRY
- Retained Earnings: -150,413,335 TRY
- Paid-in Capital: -52,883,244 TRY
- Accumulated Revaluation Surplus on Property, Plant, and Equipment: -40,906,358 TRY
-
Impact of Income Statement Items: +46,631,087 TRY
- Cost of Goods Sold: 35,969,964 TRY
- Deferred Tax Income: 23,092,309 TRY
- General Administrative and Marketing Expenses: 7,922,094 TRY
Breaking this down, the net monetary position effect stems from three main areas: non-monetary assets, non-monetary liabilities and equity, and direct income statement impacts.
The first component—non-monetary assets—is one I don’t assign much weight to here. To use a simple analogy: if a car bought years ago for 100 TRY is restated to 200 TRY today due to inflation adjustments, it doesn’t mean the car’s actual market value doubled or that I suddenly became 100 TRY richer. As long as I’m not selling, renting, or using that car to generate income, that adjustment has zero impact on my day-to-day cash flow. I firmly believe real wealth—whether for an individual or a business—stems from generating income and cash flow, not from marking up asset book values for inflation. Therefore, inflation-driven increases in property, plant, and equipment don’t carry much weight in my valuation. The inventory side is a bit different, but for Kapeks Kimya, the impact isn’t large enough to sway the overall picture.
The second area—non-monetary liabilities and equity—is where I’m most skeptical. Here, accounting line items like retained earnings, paid-in capital, and revaluation surpluses exert significant drag without causing any actual cash outflow. When inflation accounting drags down net income through retained earnings or paid-in capital adjustments, I don’t treat that as a strike against the company’s operational strength.
The third piece—direct income statement impacts—is where things can actually carry weight. But its significance varies wildly depending on the company. For retail, banking, insurance, asset management, or factoring, net monetary position effects behave very differently. For Kapeks Kimya, considering both its business model and the relative magnitude of these numbers, I don’t think the net monetary position loss should play a decisive role in valuation.
I should clarify that this approach isn’t a blanket rule for every company. I don’t advocate ignoring net monetary position gain/loss entirely; each case needs to be evaluated based on the business model and the underlying components. But in Kapeks Kimya’s case, reported net profit doesn’t accurately reflect operational performance on its own. That’s why I lean much more heavily on operating profit when evaluating earning power.
I don’t treat operating profit as a direct proxy for net income either. Financial income/expenses, taxes, and net monetary position effects still need to be considered. However, operating profit remains a far more meaningful metric for assessing core profitability.
So rather than relying purely on reported net income when forecasting future earnings, I prefer assessing core operating profit first and then evaluating bottom-line adjustments separately. Since tax liabilities won’t automatically shrink just because revenue drops, tax impact needs its own evaluation as well.
Combining current operational profitability with my approach to the net monetary position, I estimate the company’s normalized annual earning power at roughly 500 million TRY. To be clear, this 500 million TRY shouldn’t be read as a net profit forecast for reporting purposes, but rather as a normalized baseline earning level I use for valuation.
Overall Assessment
Taking a step back, there are several key positives for Kapeks Kimya: its presence in a niche sector, allocating the bulk of IPO proceeds to growth initiatives like new plants, warehouses, modernization, and capacity expansion, low financial debt, no secondary share sales, and keeping the public float at around 20%. Furthermore, upcoming investments offer potential to expand production capacity and boost future revenue.
However, the company going public at a valuation of roughly 11.76 billion TRY is the single biggest issue that overshadows these positives for me. The ongoing revenue decline, persistent tight monetary policy, elevated interest rates, weak demand, and the continued slowdown in the industrial sector make it tough to justify the current valuation.
If top-line revenue stays on a downward trajectory, the earnings baseline I used for valuation will also come under pressure. While growth investments funded by the IPO could yield long-term benefits, I don’t see them generating enough earnings in the near term to back an 11.76 billion TRY valuation.
In conclusion, while I generally like Kapeks Kimya’s business model, niche sector, balance sheet, and deployment of IPO proceeds, I find the IPO valuation steep. Even with an estimated 20% IPO discount, I believe the current price tag sits roughly 50–60% above what I consider reasonable.
LEGAL DISCLAIMER: This content does not constitute investment advisory services. Investment advisory is a personalized service provided based on an individual’s risk-return profile, financial standing, and investment objectives. The information, commentary, and assessments provided herein are prepared solely for general informational purposes and should not be construed as investment recommendations or guidance. This content may not align with the reader’s financial position or risk-return preferences; therefore, investing based solely on this information may not yield the expected outcomes.